Case study · Affiliate niche site · 2018–2022
How 32 Bottom-of-Funnel Articles Drove $92,652 in Amazon Sales and a $9,270 Exit
BlenderTampers.com was a small affiliate site I bootstrapped and built from scratch. It helped shoppers choose heavy-duty blenders and the compatible accessories and parts. Every page targeted a buyer close to a decision. Here’s the raw data, and what B2B SaaS teams can take from it.
Free · 20 minutes · written summary within 24 hours
$9,270
exit on MotionInvest, 31x the average monthly profit
$92,652
in Amazon sales referred, Jan 2021 – Jul 2022
$159
in commissions per 1,000 pageviews, last 12 months
99%
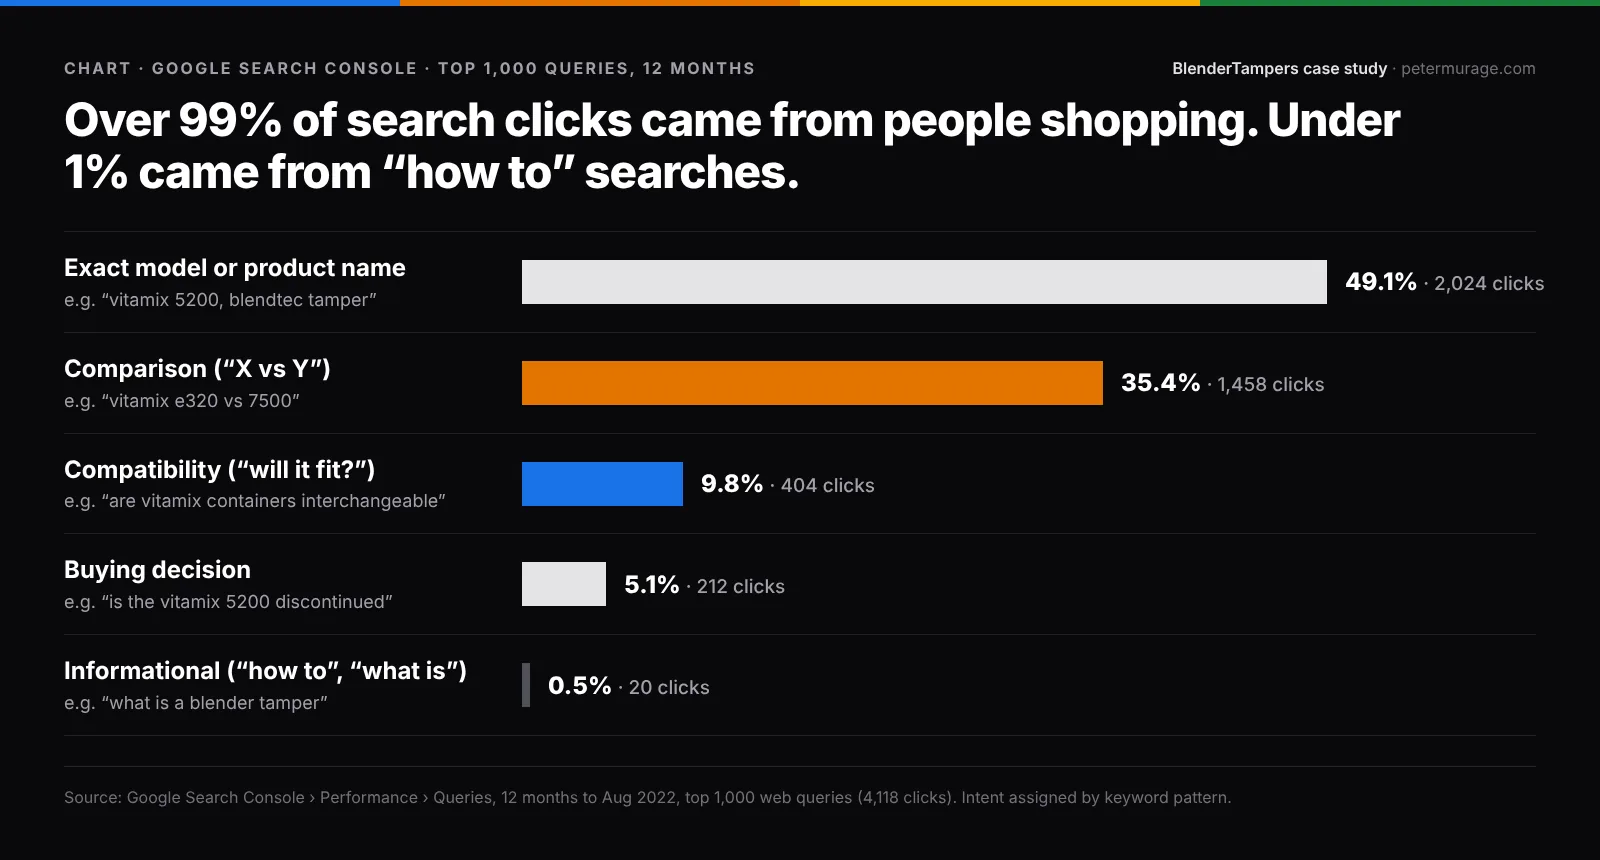
of search clicks came from shopping queries
The short version
One Person, 32 Buying-Stage Pages, One Exit
- I wrote for people about to buy. 32 articles: 23 comparisons, 5 tamper pages, 3 buying guides, and 1 compatibility guide.
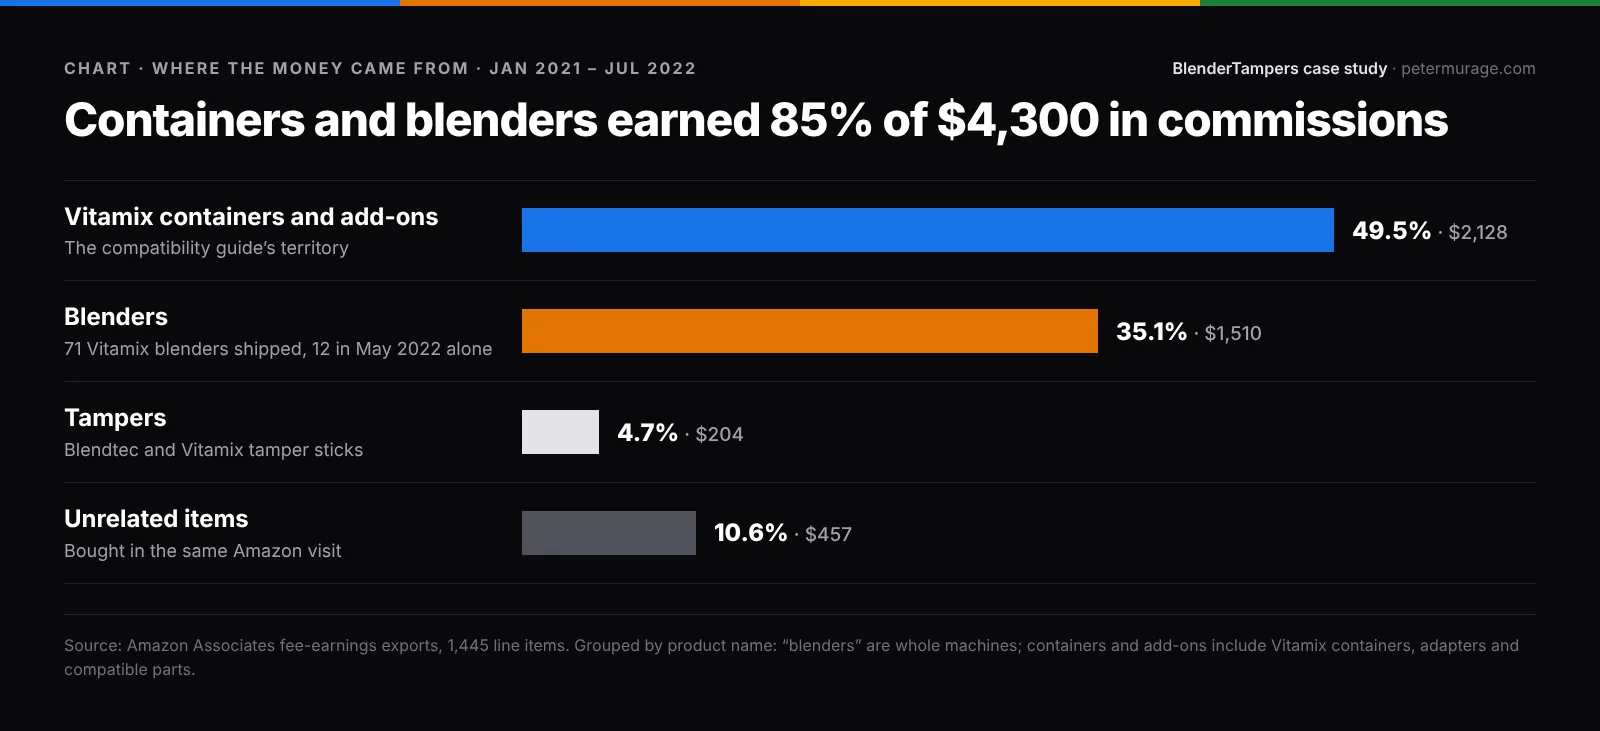
- That one compatibility guide pulled 53% of all pageviews. Containers and blenders earned 85% of commissions.
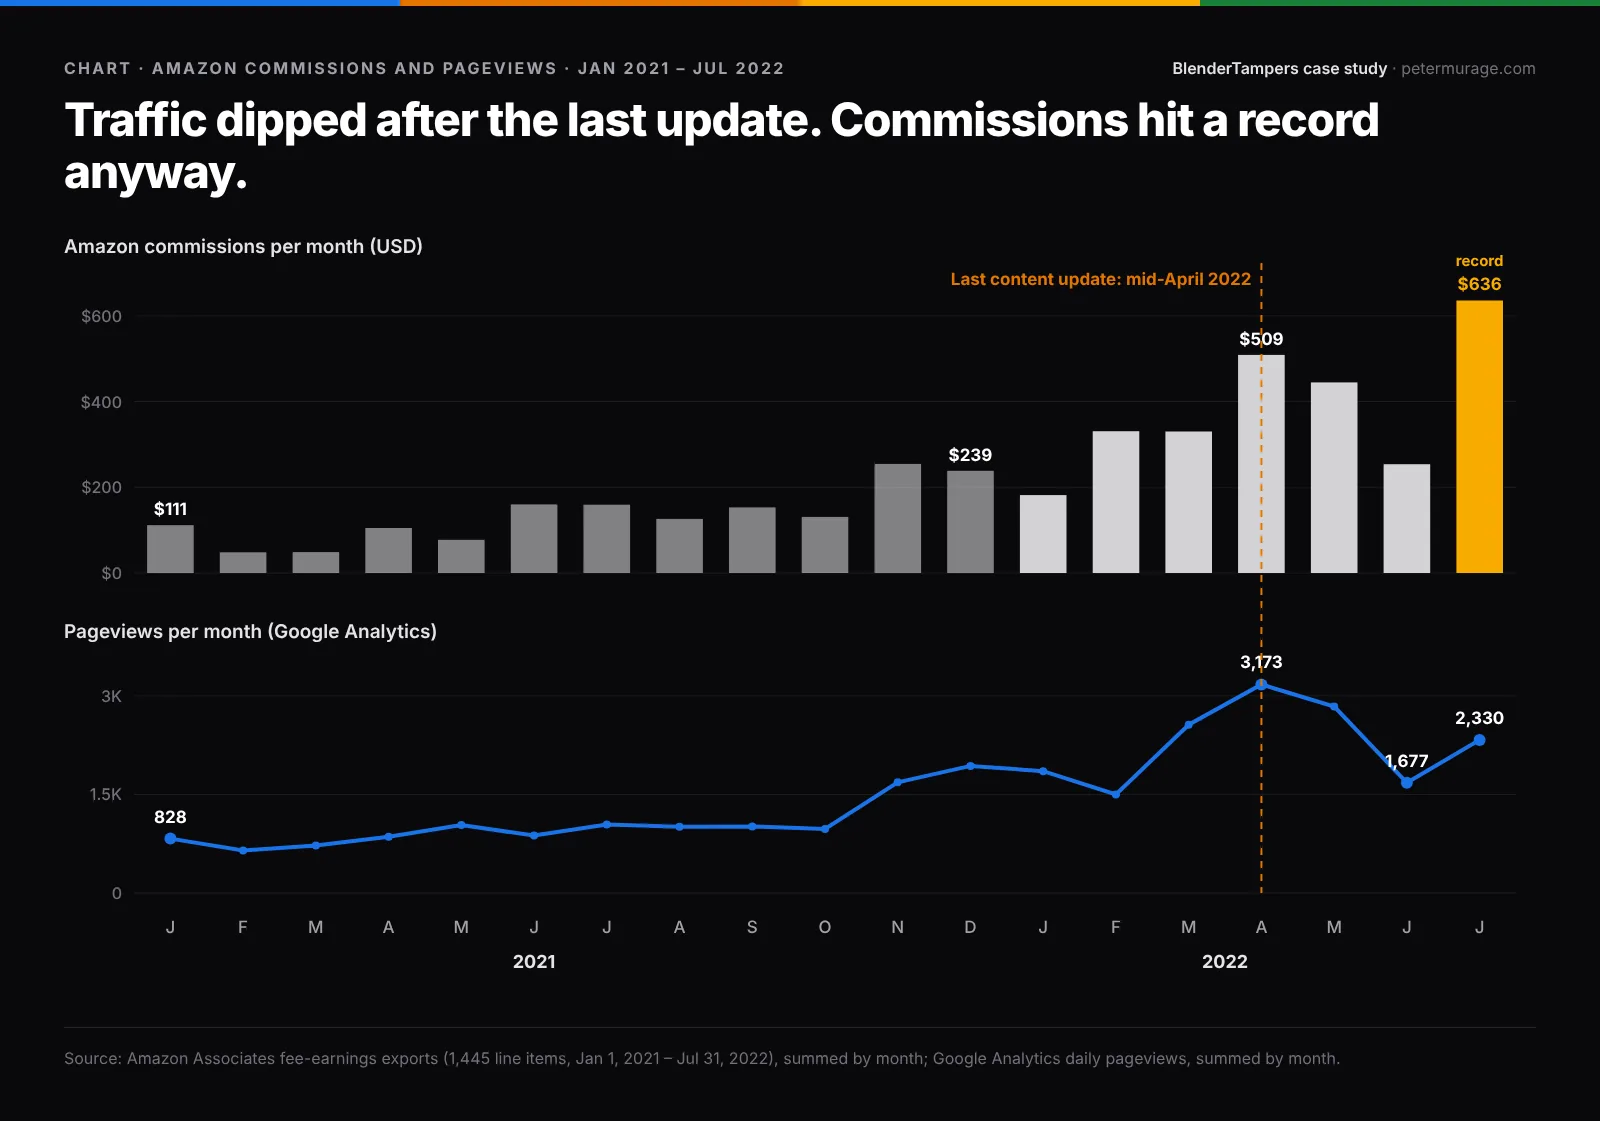
- Commissions grew 3.8x year over year (January to July). July 2022 was the record month.
- The site sold at its reserve price, two days after the first offer.
Why a SaaS team should care
Swap “Vitamix E320 vs 7500” for “HubSpot vs Pipedrive”. Swap “will this container fit my blender?” for “does it integrate with Salesforce?”.
The buyer is the same. They have a shortlist. They’re afraid of choosing wrong. They want an honest tie-breaker. The pages that give it to them get the sale.
01The challenge
A $300 to $650 Blender Is a Careful Purchase
Vitamix sells at least a dozen look-alike models. Its containers fit only some of them. Blendtec blenders ship without a tamper at all.
So shoppers asked the same three questions in Reddit kitchen threads, Facebook recipe groups, and YouTube comments:
- Which model should I buy?
- Will this container fit my machine?
- How do I blend thick smoothies without a tamper?
Big review sites ranked “best blenders”. Few answered these exact questions. My constraints: one person, no writers, no budget for links. So, DIY.
02The insight
The Buyers Wrote My Content Brief
It started with one comment in a Keto-Mediterranean Diet Group on Facebook. A member said personal blenders like the NutriBullet couldn’t handle thick, creamy smoothies.
I got curious. For about three months, I read Reddit, Quora, Facebook groups, and YouTube demos. The same questions kept coming back, almost word for word.
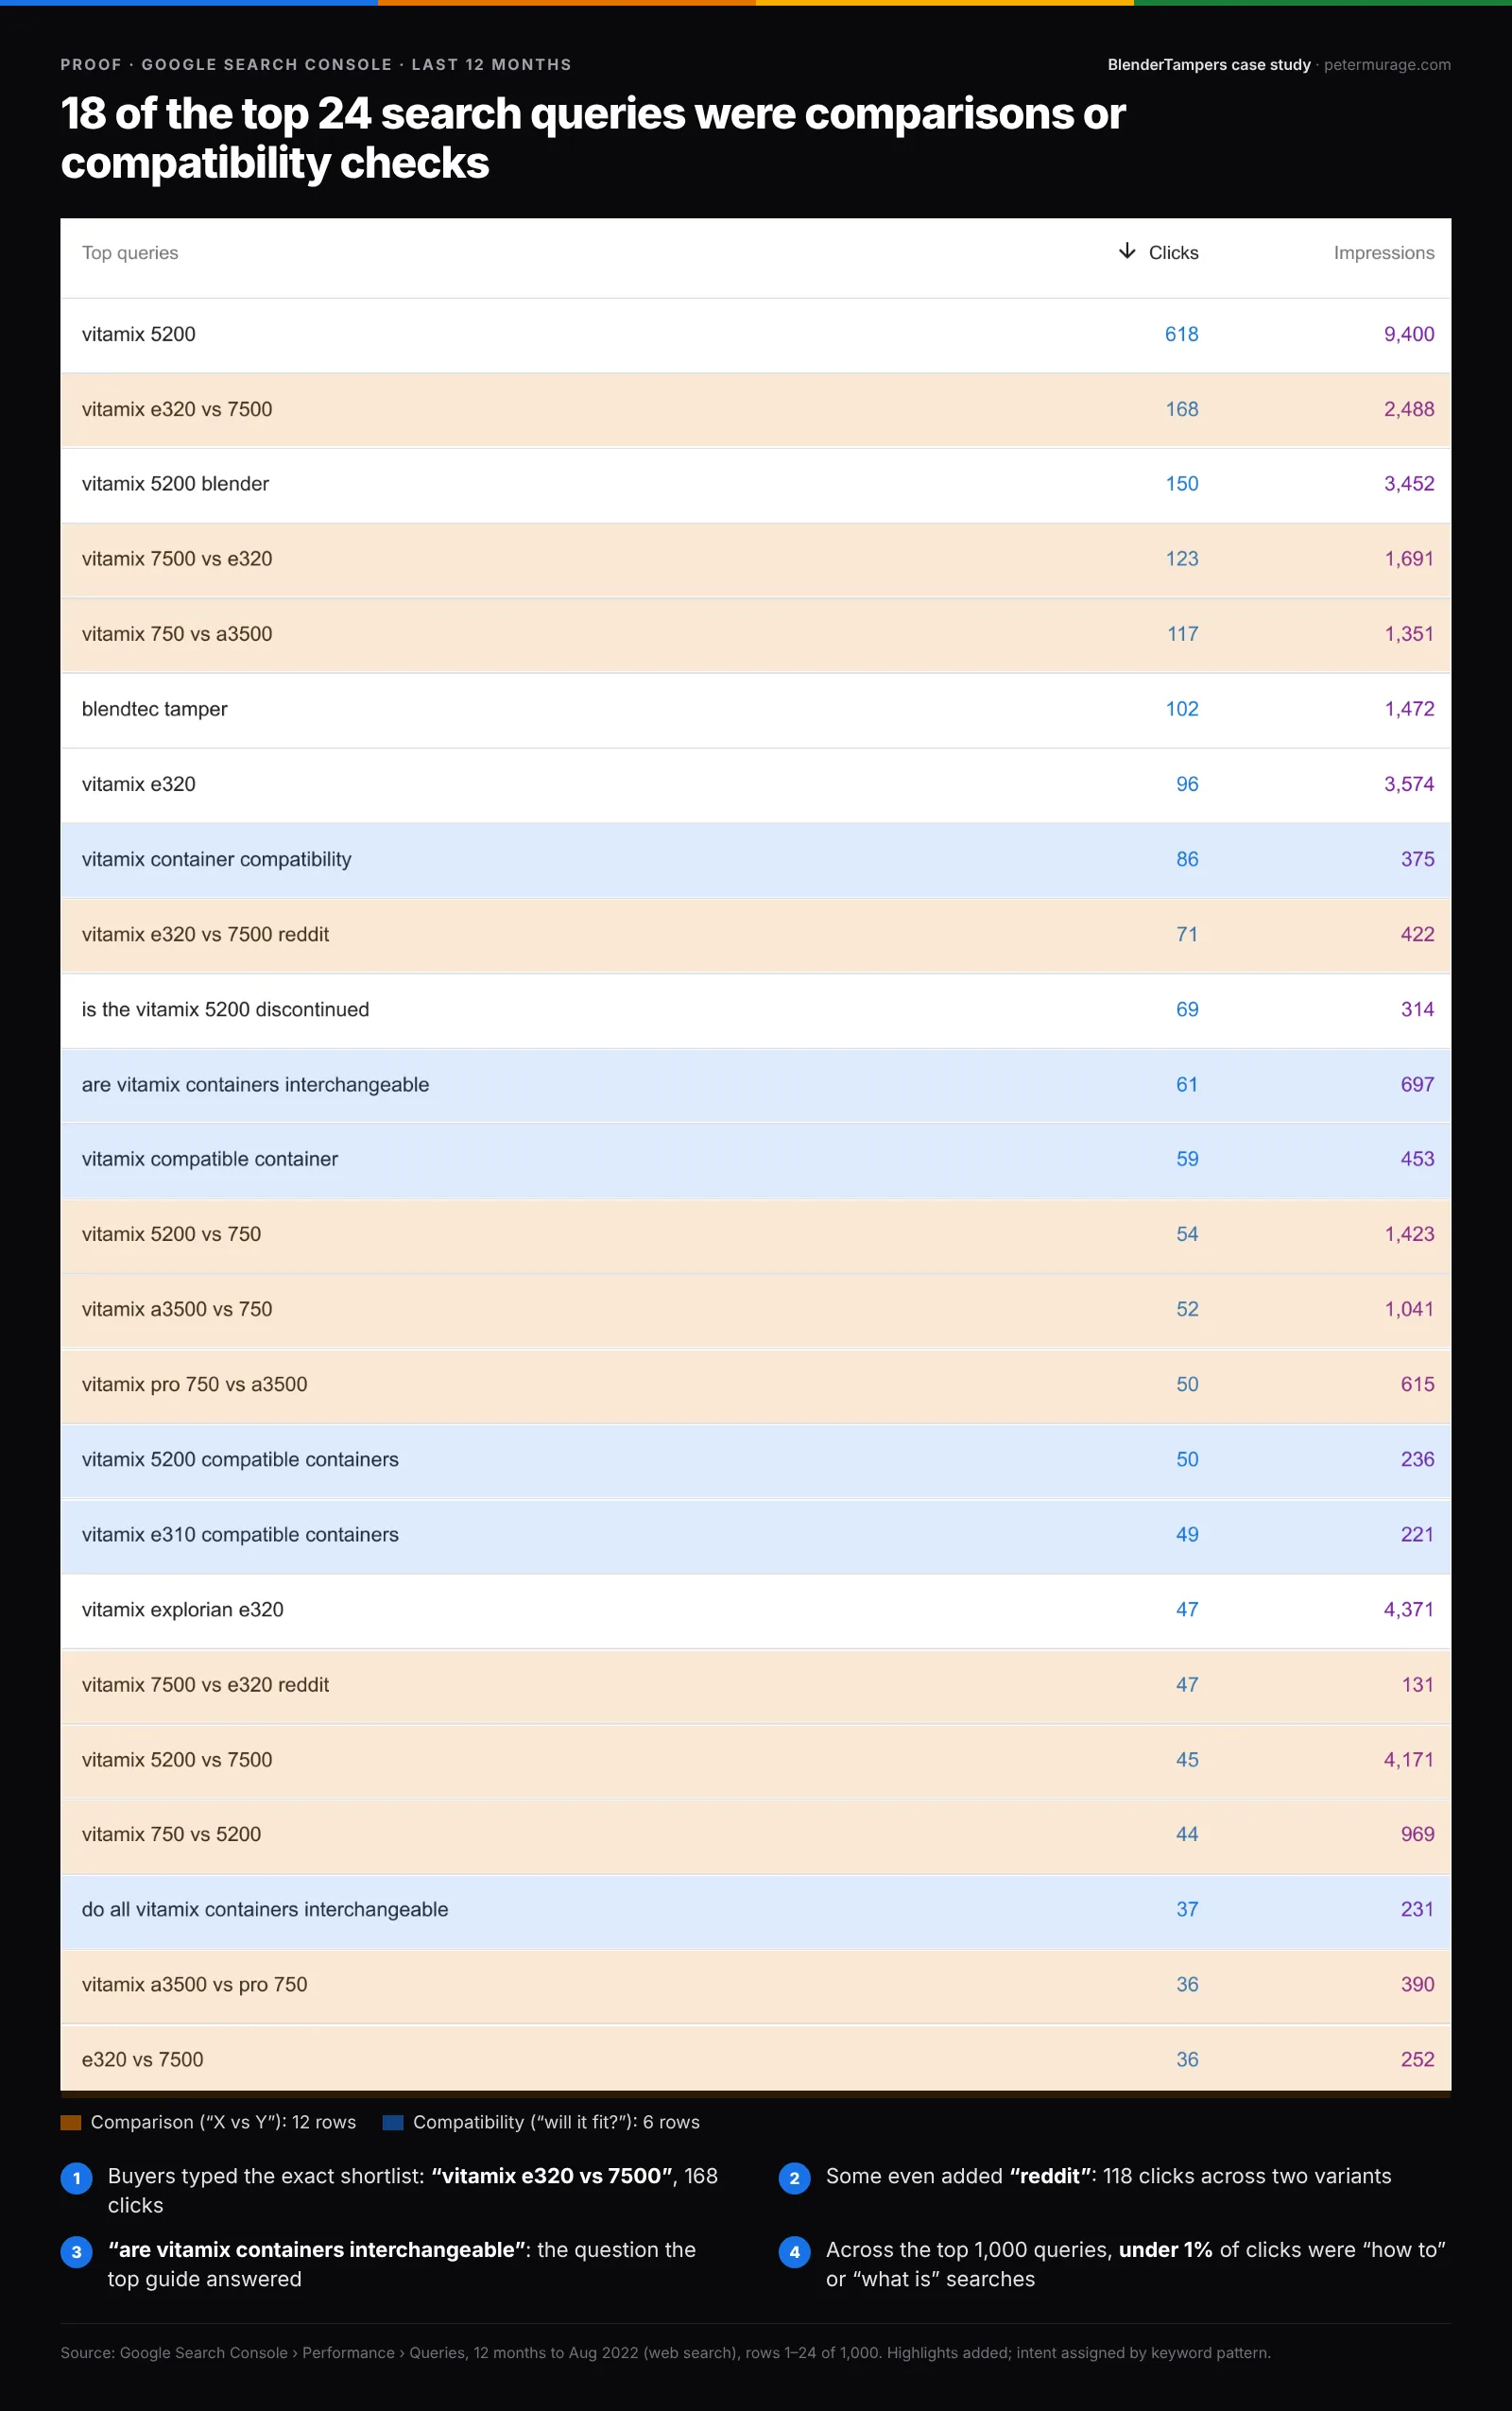
Search data later proved it. People typed “vitamix e320 vs 7500 reddit”. Two versions of that query brought 118 clicks in 12 months.Google Search Console, 12 months to August 2022
The research led me to an inventor and former Vitamix demonstrator. He had engineered a tamper stick that fits both Vitamix and Blendtec blenders. We agreed on a referral partnership, and I registered BlenderTampers.com on June 4, 2018.
When his tamper went on Amazon, I added Amazon links. Then I wrote for the next questions buyers asked: which containers fit, and which Vitamix to buy.
03The strategy
Four Page Types, All Close to the Purchase
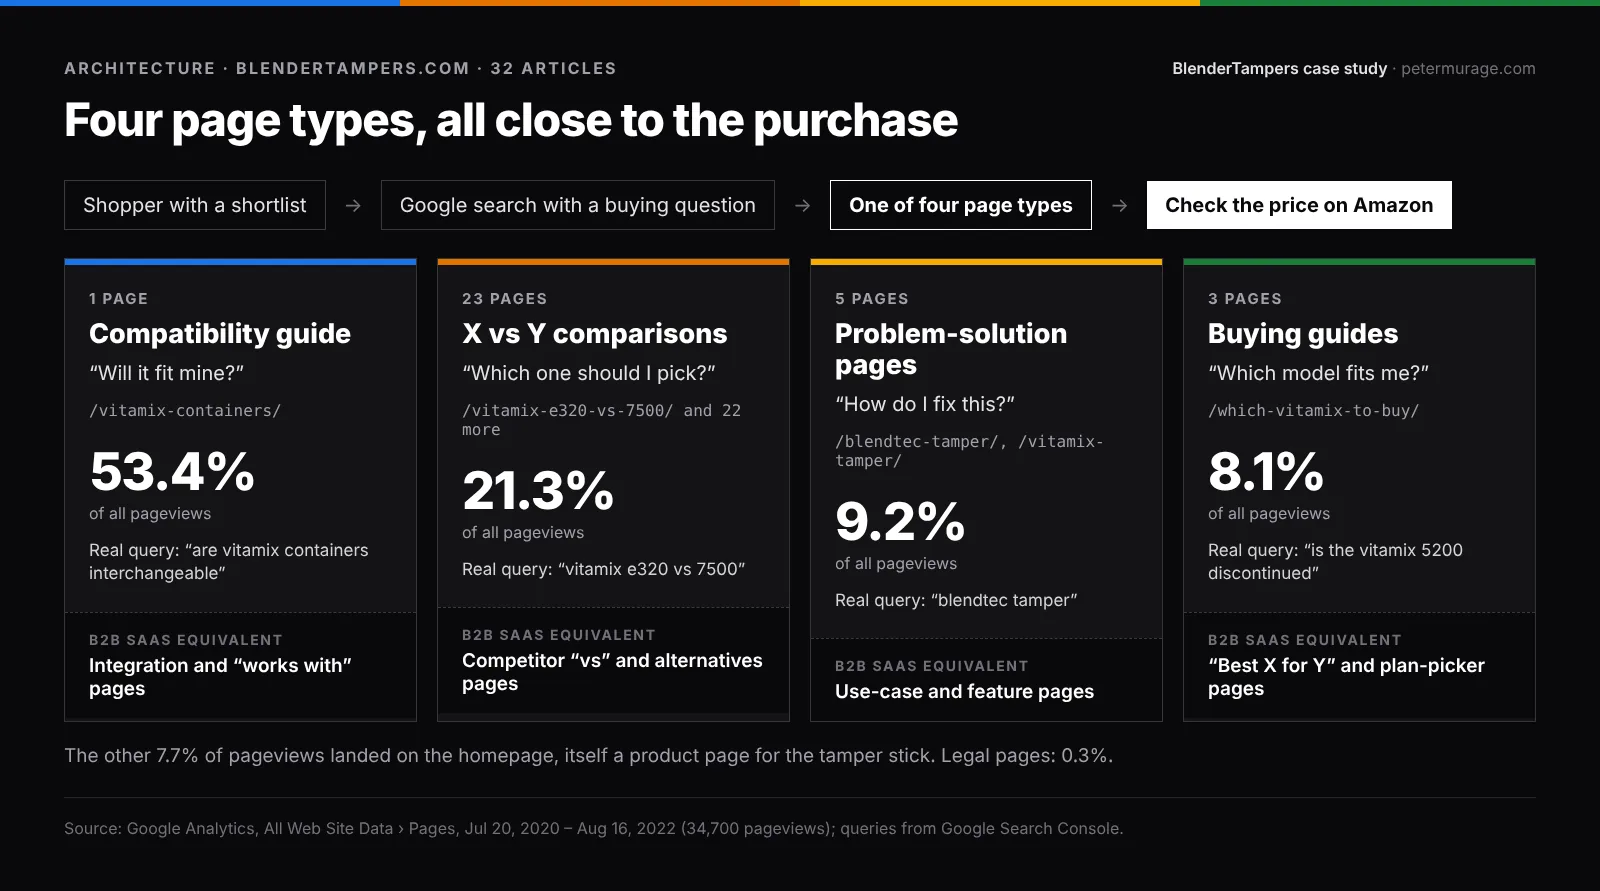
Every article matched one buying question. Each type has a direct B2B SaaS twin.
| Page type | The buyer’s question | Real query (Search Console) | Pages | Share of pageviews | B2B SaaS equivalent |
|---|---|---|---|---|---|
| Compatibility guide | Will it fit mine? | are vitamix containers interchangeable | 1 | 53.4% | Integration and “works with” pages |
| X vs Y comparison | Which one should I pick? | vitamix e320 vs 7500 | 23 | 21.3% | “vs” and alternatives pages |
| Problem-solution page | How do I fix this? | blendtec tamper | 5 | 9.2% | Use-case and feature pages |
| Buying guide | Which model fits me? | is the vitamix 5200 discontinued | 3 | 8.1% | “Best X for Y” and plan-picker pages |
04The build
Lean, Fast, and One Next Step
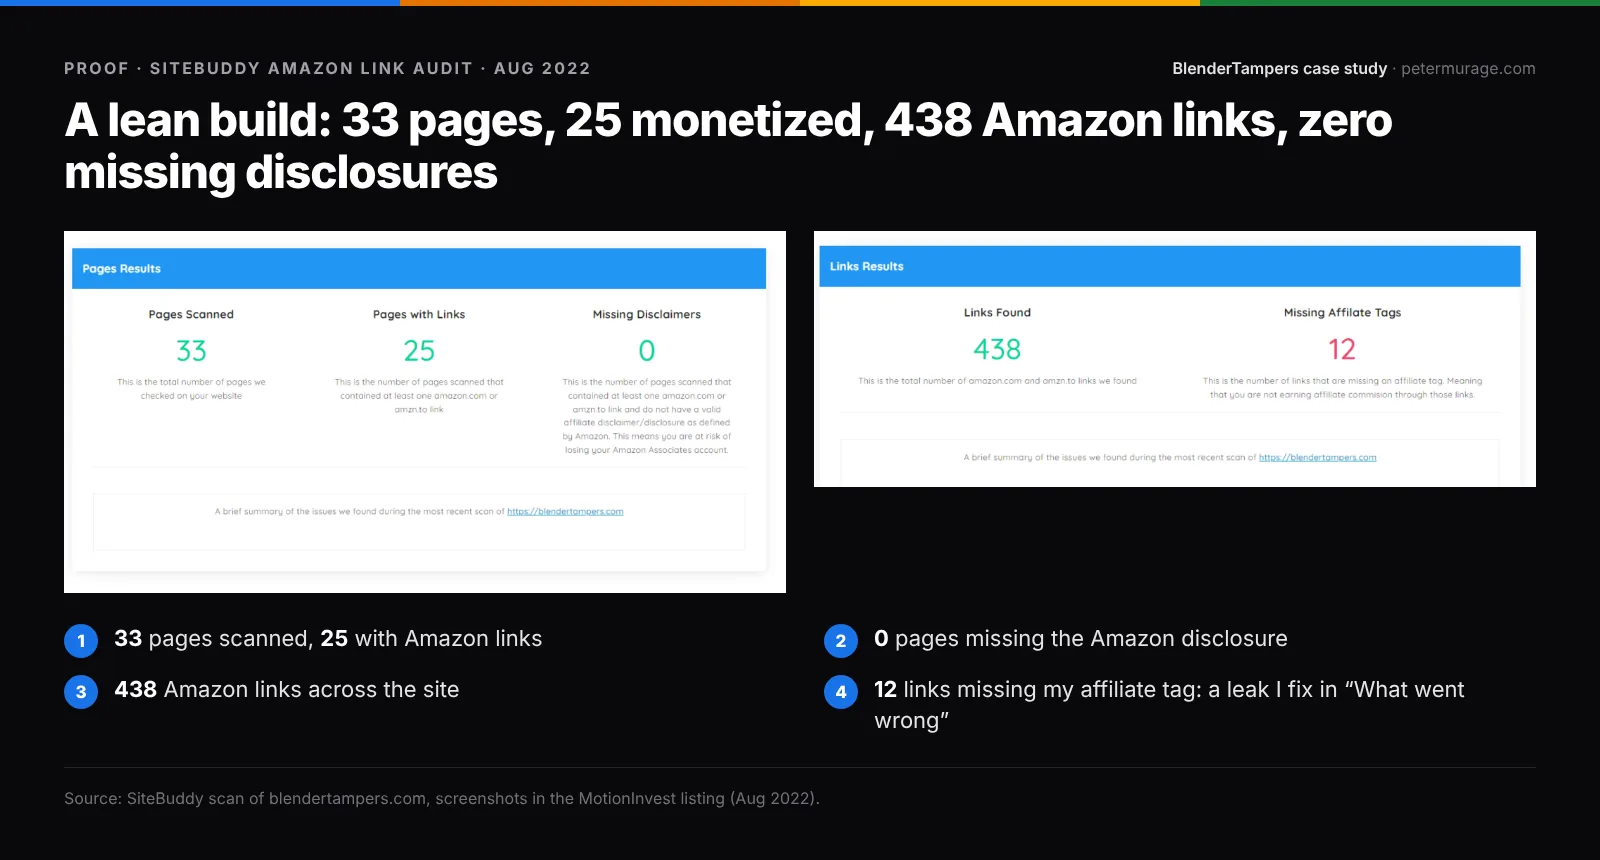
- 32 articles on 33 pages. 25 pages carried Amazon links: 438 links to 75 products. Every one had the Amazon disclosure.
- WordPress and GeneratePress, self-hosted on SiteGround. Rank Math for on-page SEO.
- Graphics made in Illustrator and Canva, exported as light PNGs for speed.
- Keyword research, on-page, and technical SEO (speed, crawlability) done myself.
- Links earned by answering questions in Facebook groups and comment threads: 135 referring domains by August 2022.
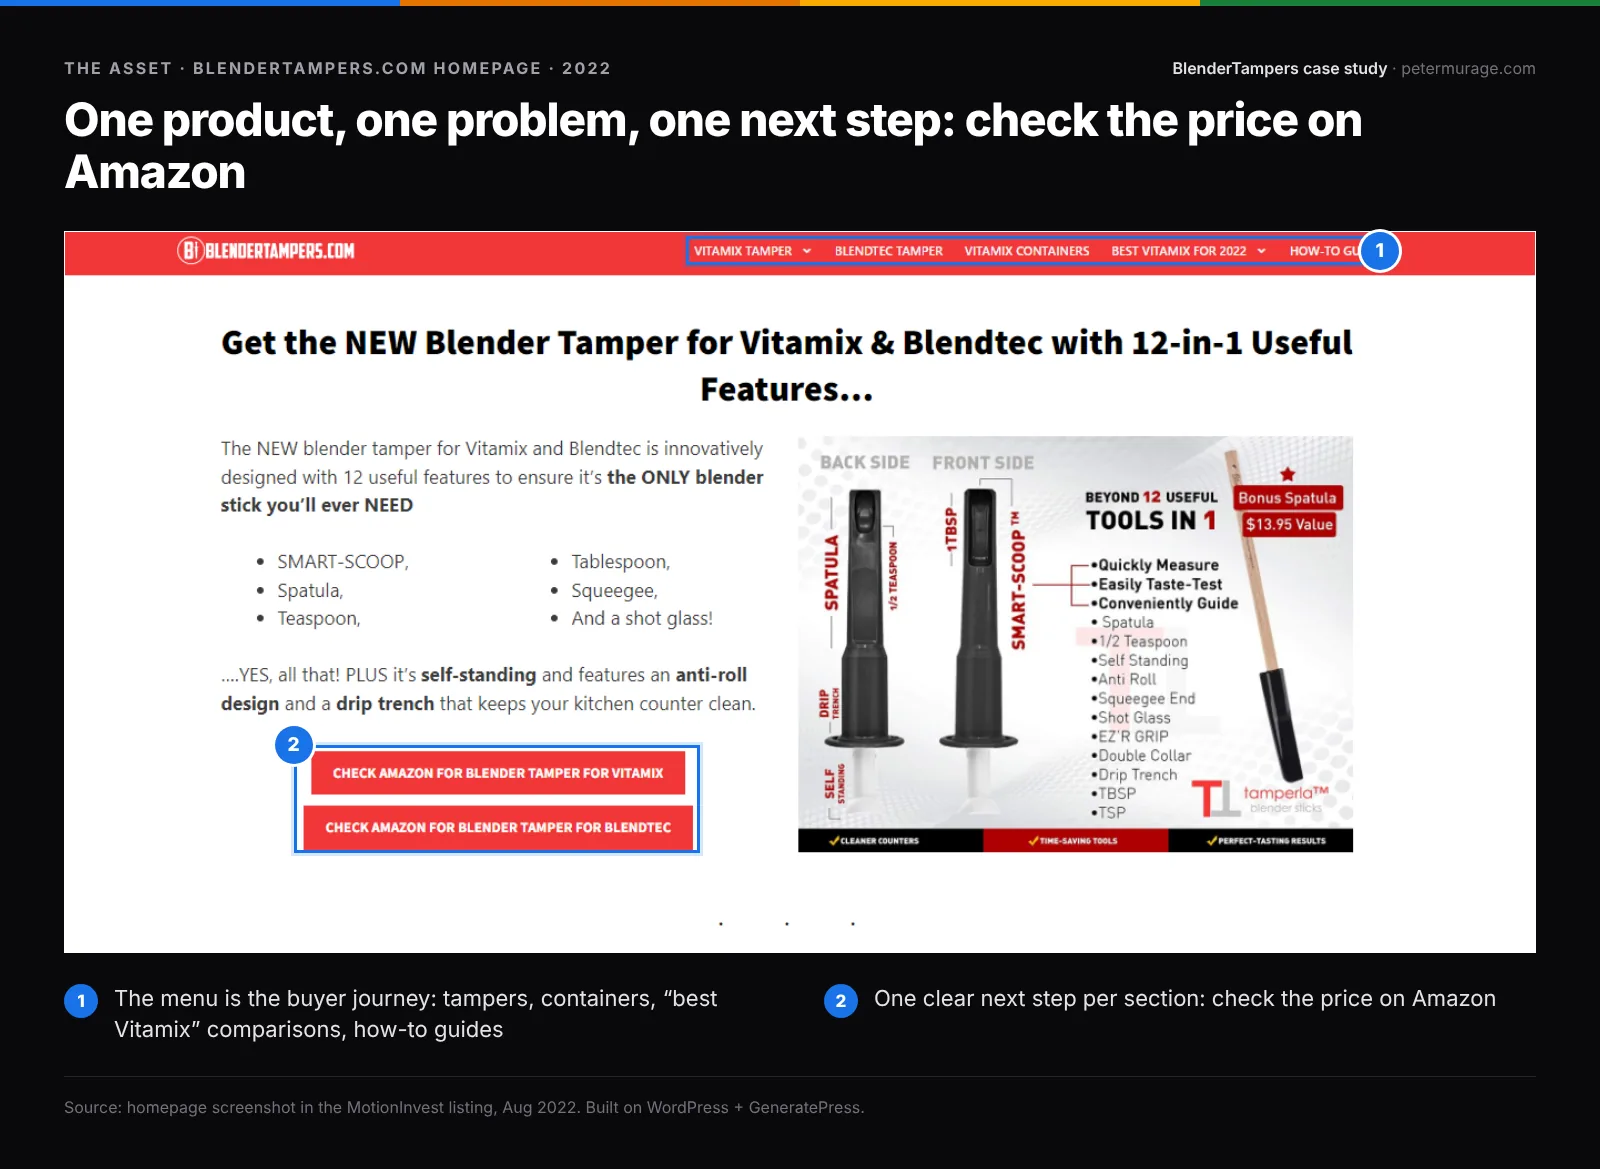
- One call to action per decision: check the price on Amazon.
05The results
Four Numbers, Each With a Screenshot
Every figure below comes from the Amazon, Google Analytics, and Search Console exports I still have. The screenshots show the exact numbers.
RESULT 5.1
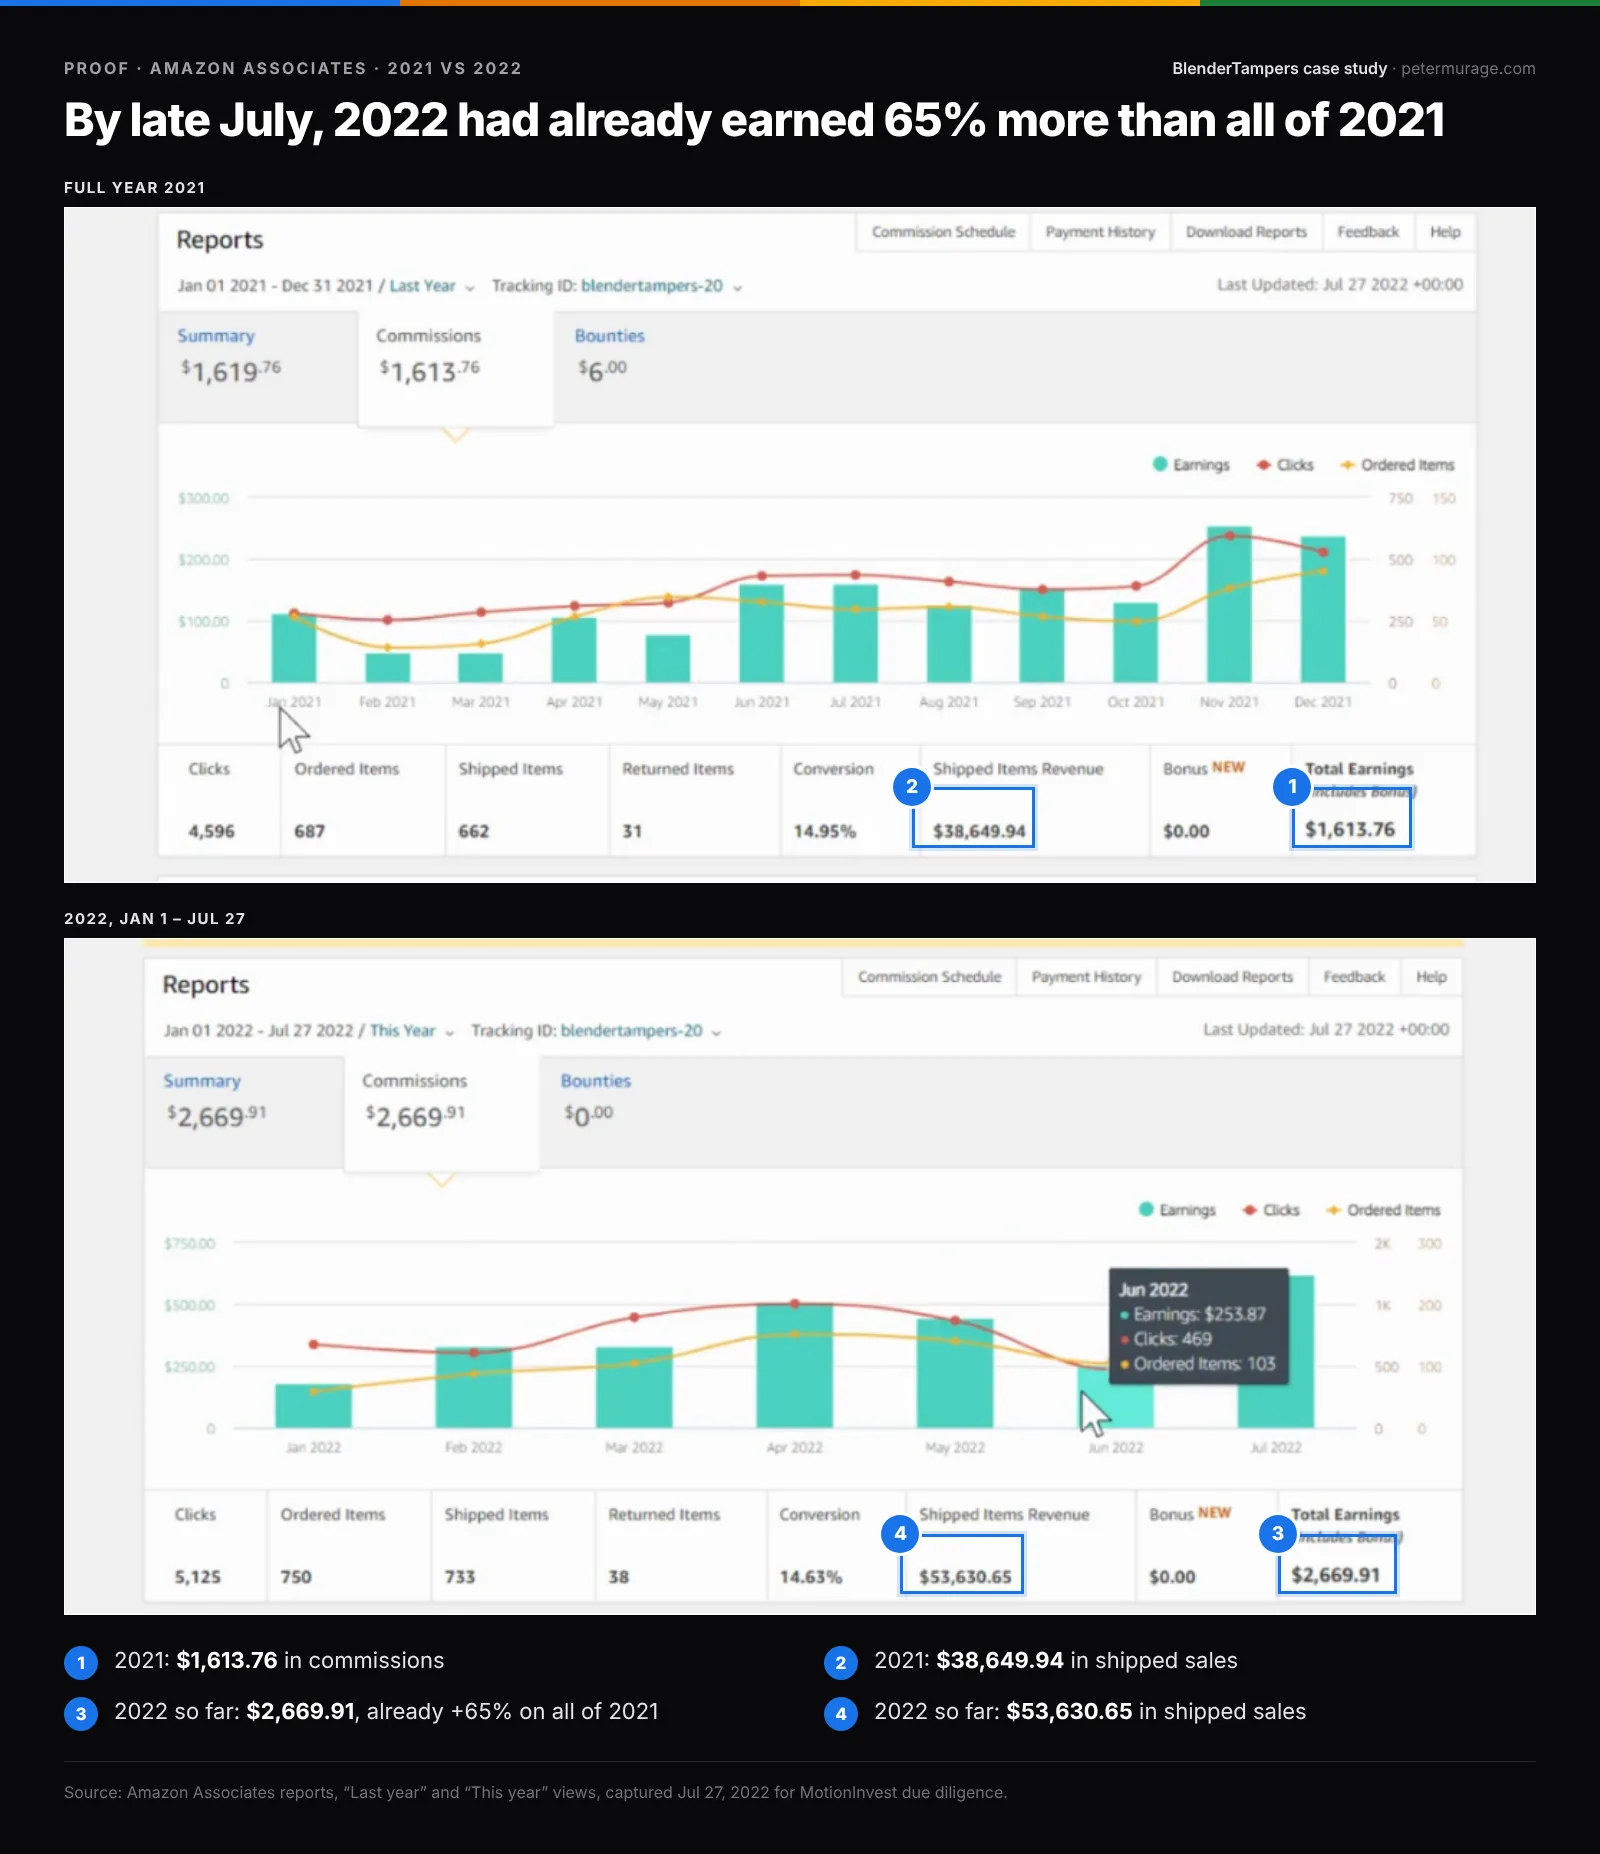
$92,652 in Amazon Sales and $4,300 in Commissions in 19 Months
- 1,401 items shipped, including 71 Vitamix blenders.
- 10 to 12 blenders a month at the April–May 2022 peak.
- By late July, 2022 had already out-earned all of 2021 by 65%.
RESULT 5.2
One Compatibility Guide Pulled 53% of All Pageviews
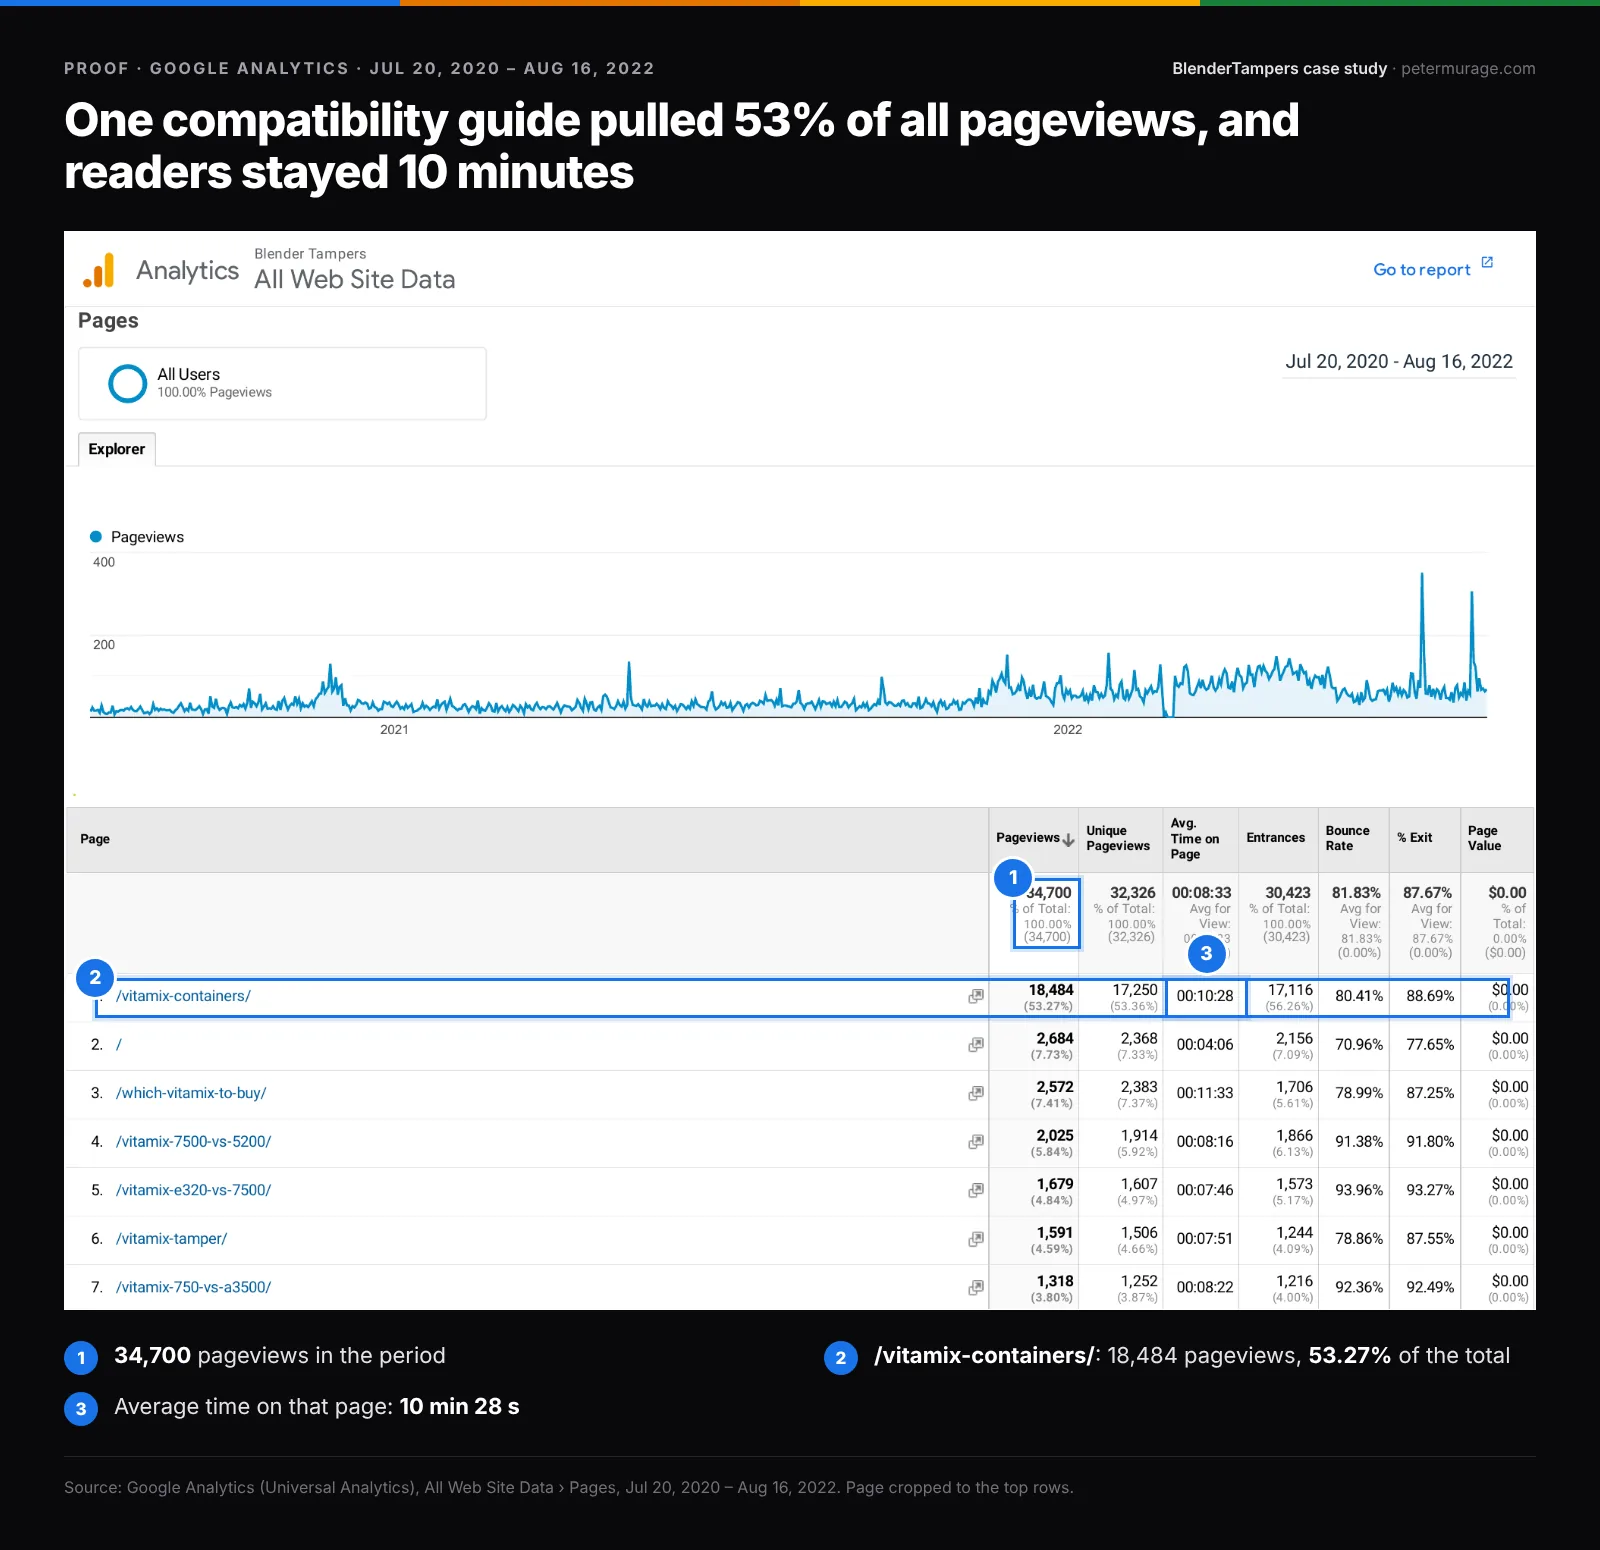
- /vitamix-containers/ had 18,484 of 34,700 pageviews.
- Readers stayed 10 minutes and 28 seconds on average.
- Containers and add-ons earned 49.5% of commissions. Blenders earned 35.1%.
RESULT 5.3
Over 99% of Search Clicks Came From Shopping Queries
- 35.4% of clicks came from “X vs Y” comparisons.
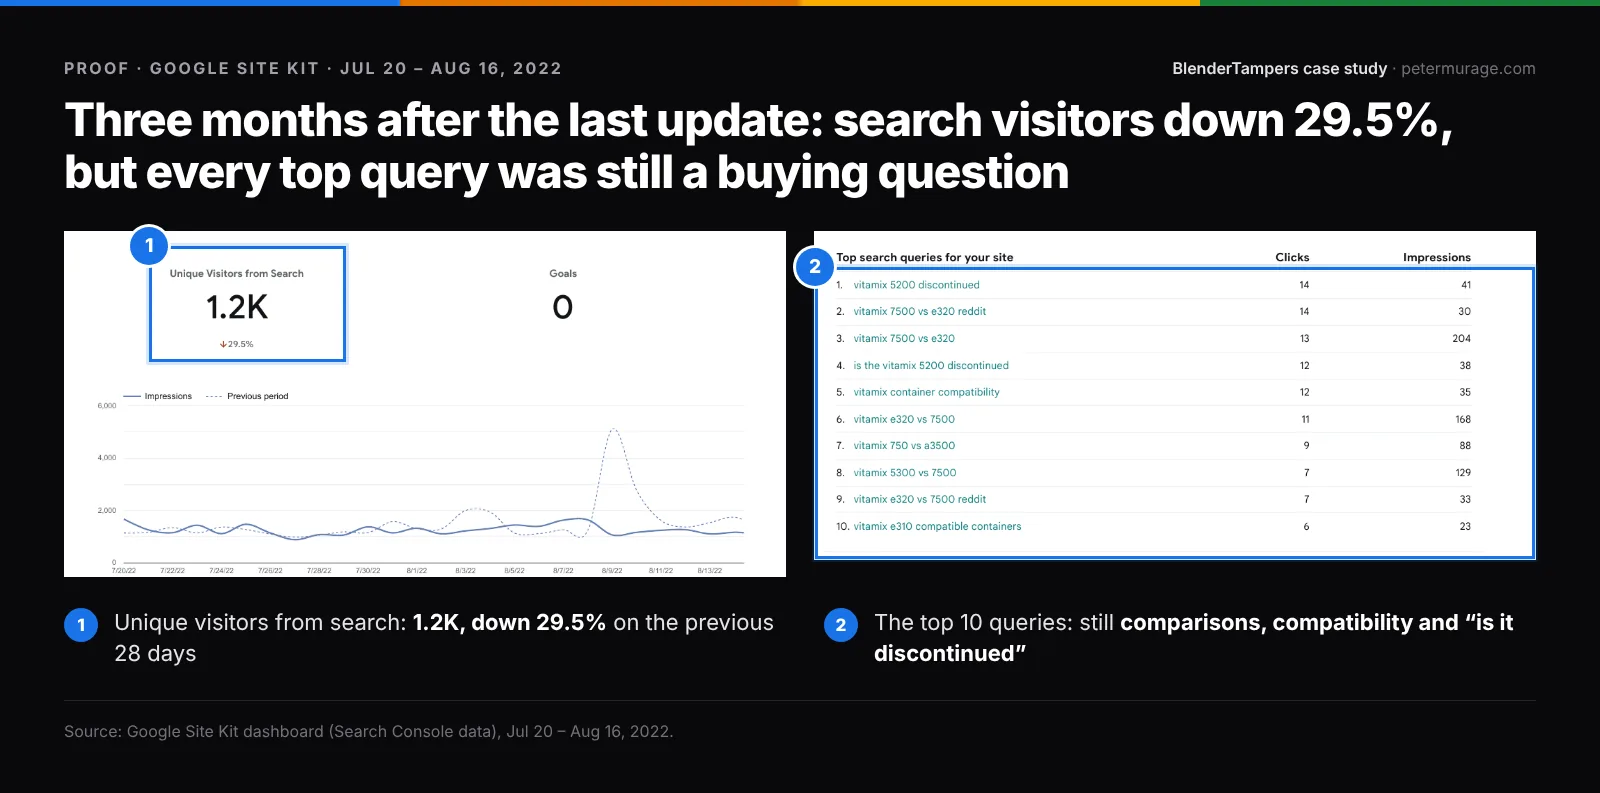
- 18 of the top 24 queries were comparisons or compatibility checks.
- “How to” and “what is” searches brought 0.5% of clicks.
RESULT 5.4
$159 in Commissions per 1,000 Pageviews
- That’s over the final 12 months, August 2021 to July 2022.
- In July 2022, the record month, it was $273.
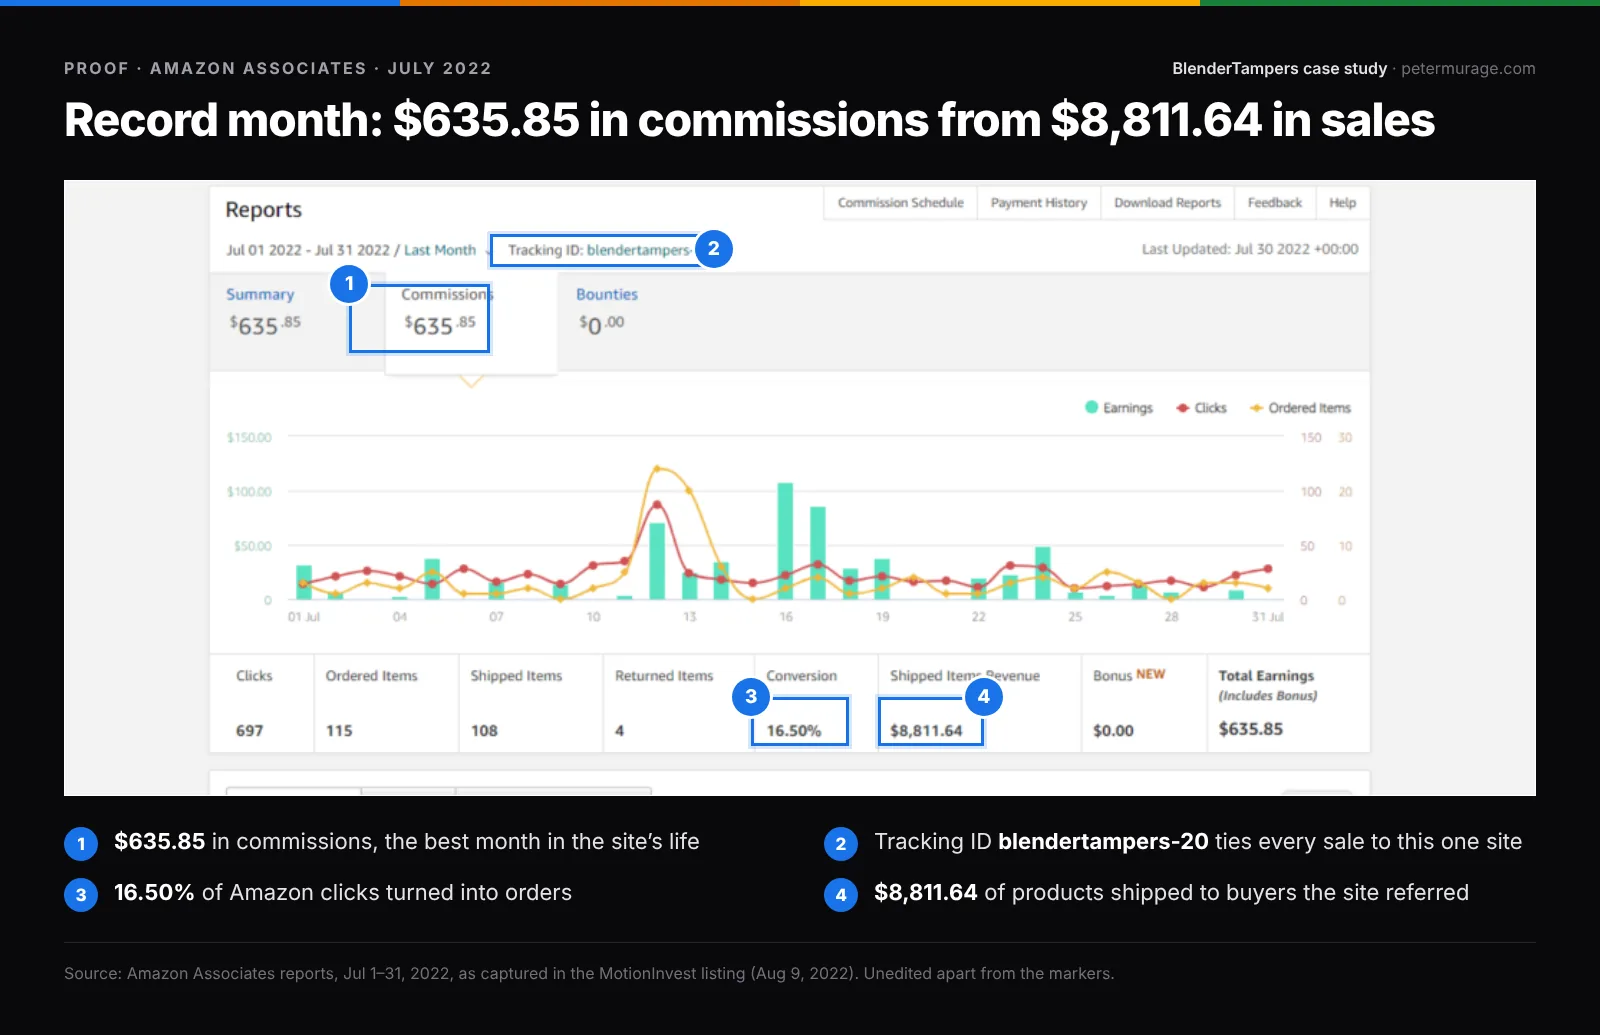
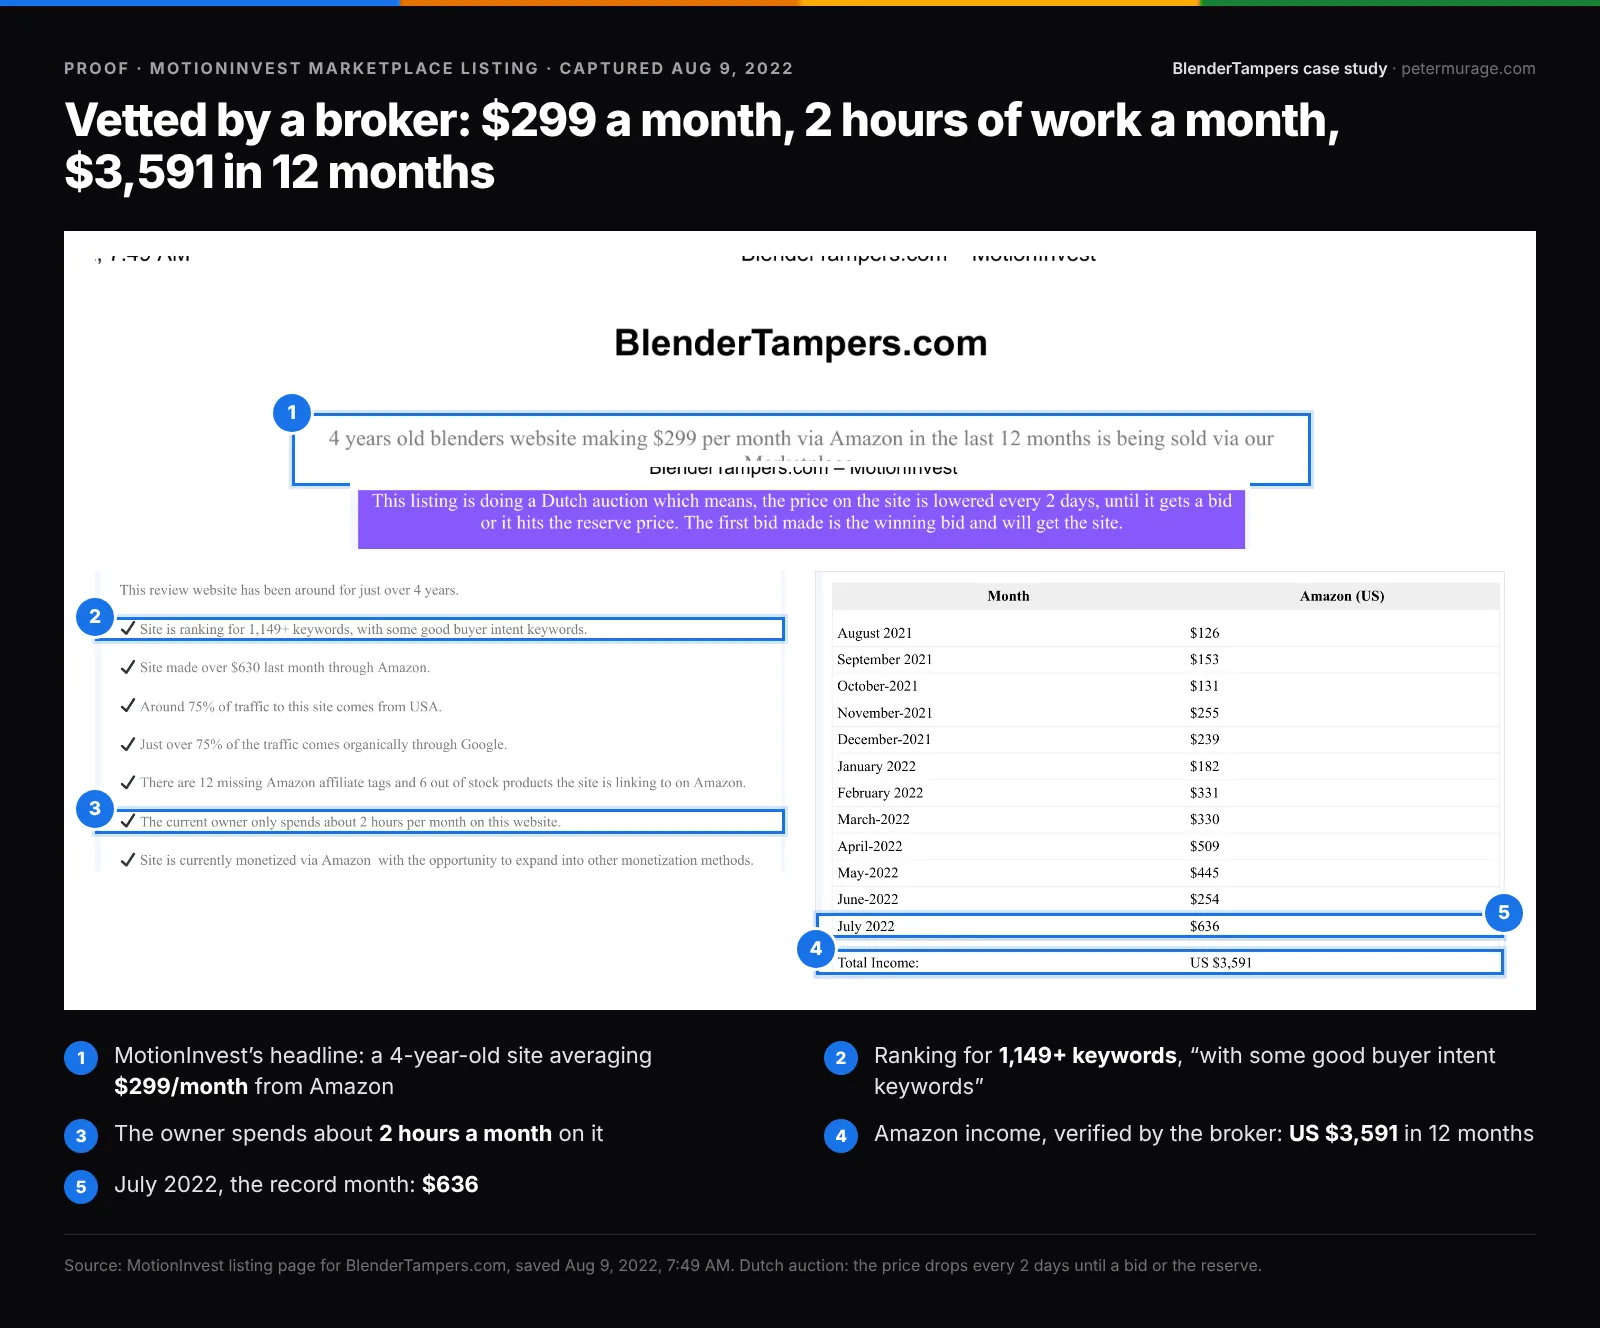
- That month brought $635.85 in commissions from $8,811.64 in sales. 16.5% of Amazon clicks became orders.
Your Buyers Are Typing “[you] vs [competitor]” Right Now.
On a free 20-minute call, I’ll review 2–3 of your comparison, alternatives, or integration pages. You get a written summary within 24 hours.
06The exit
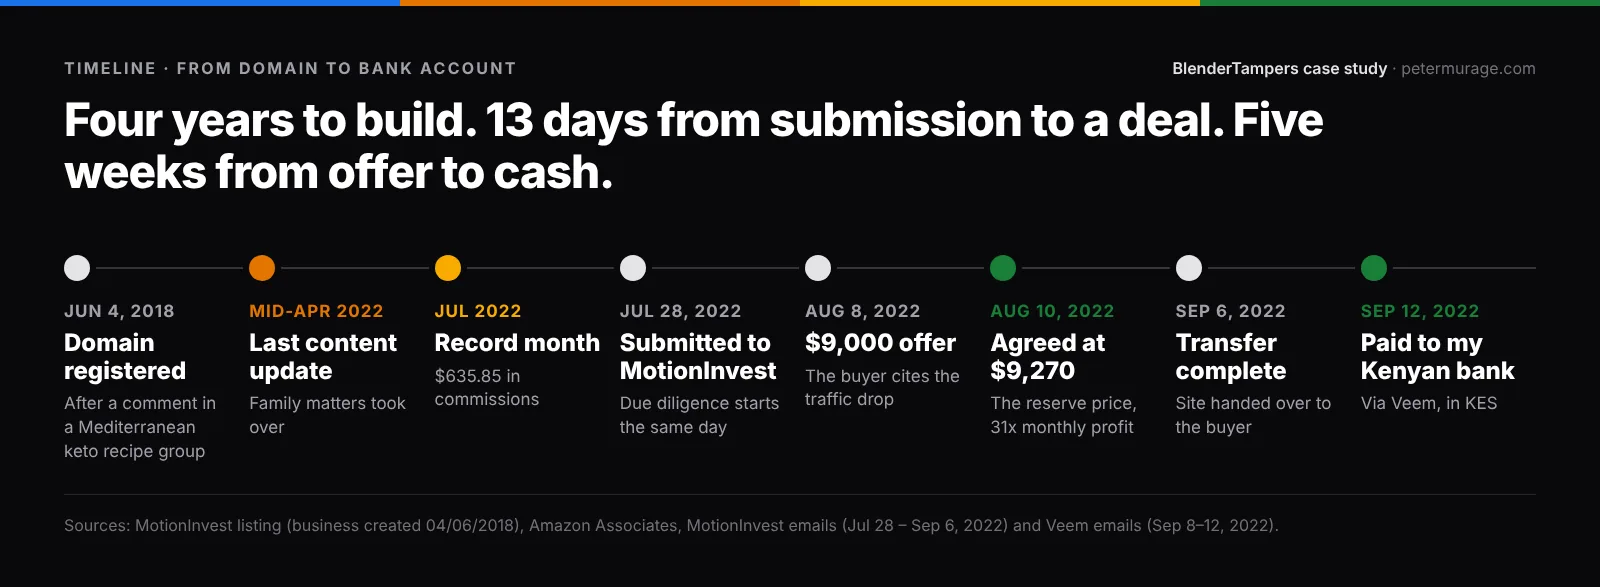
From Submission to an Agreed Price in 13 Days
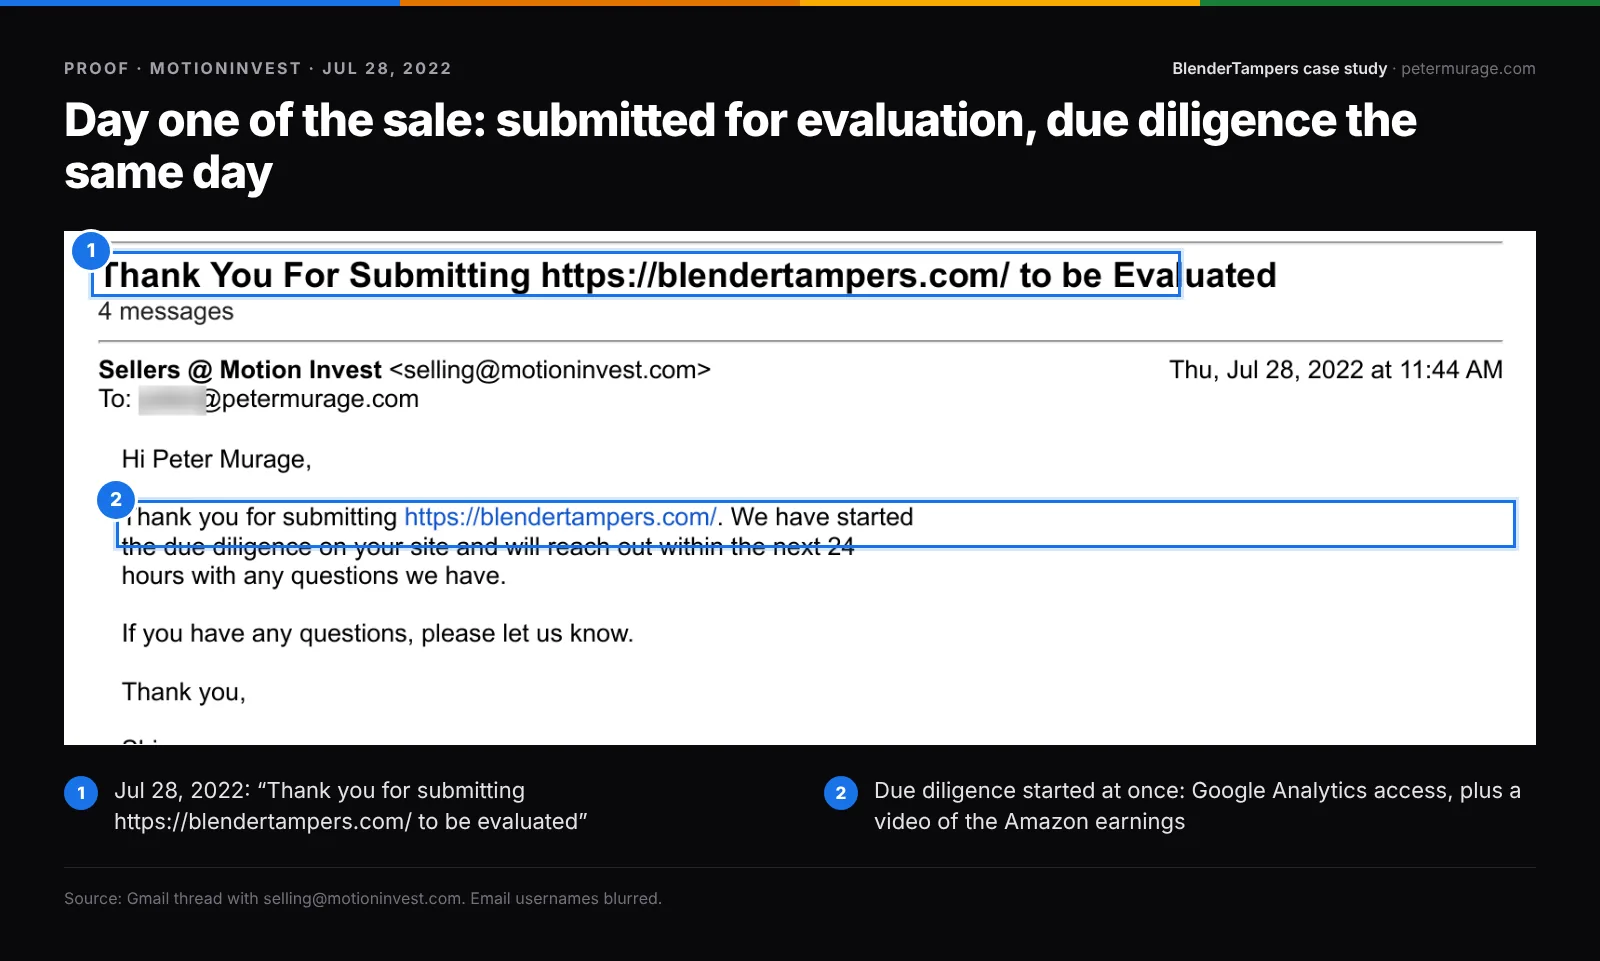
- Jul 28, 2022: I submitted the site to MotionInvest. Due diligence started that day: read-only Google Analytics access and a video of my Amazon earnings.
- Early August: the listing went live as a Dutch auction at $9,870, with a $9,270 reserve.
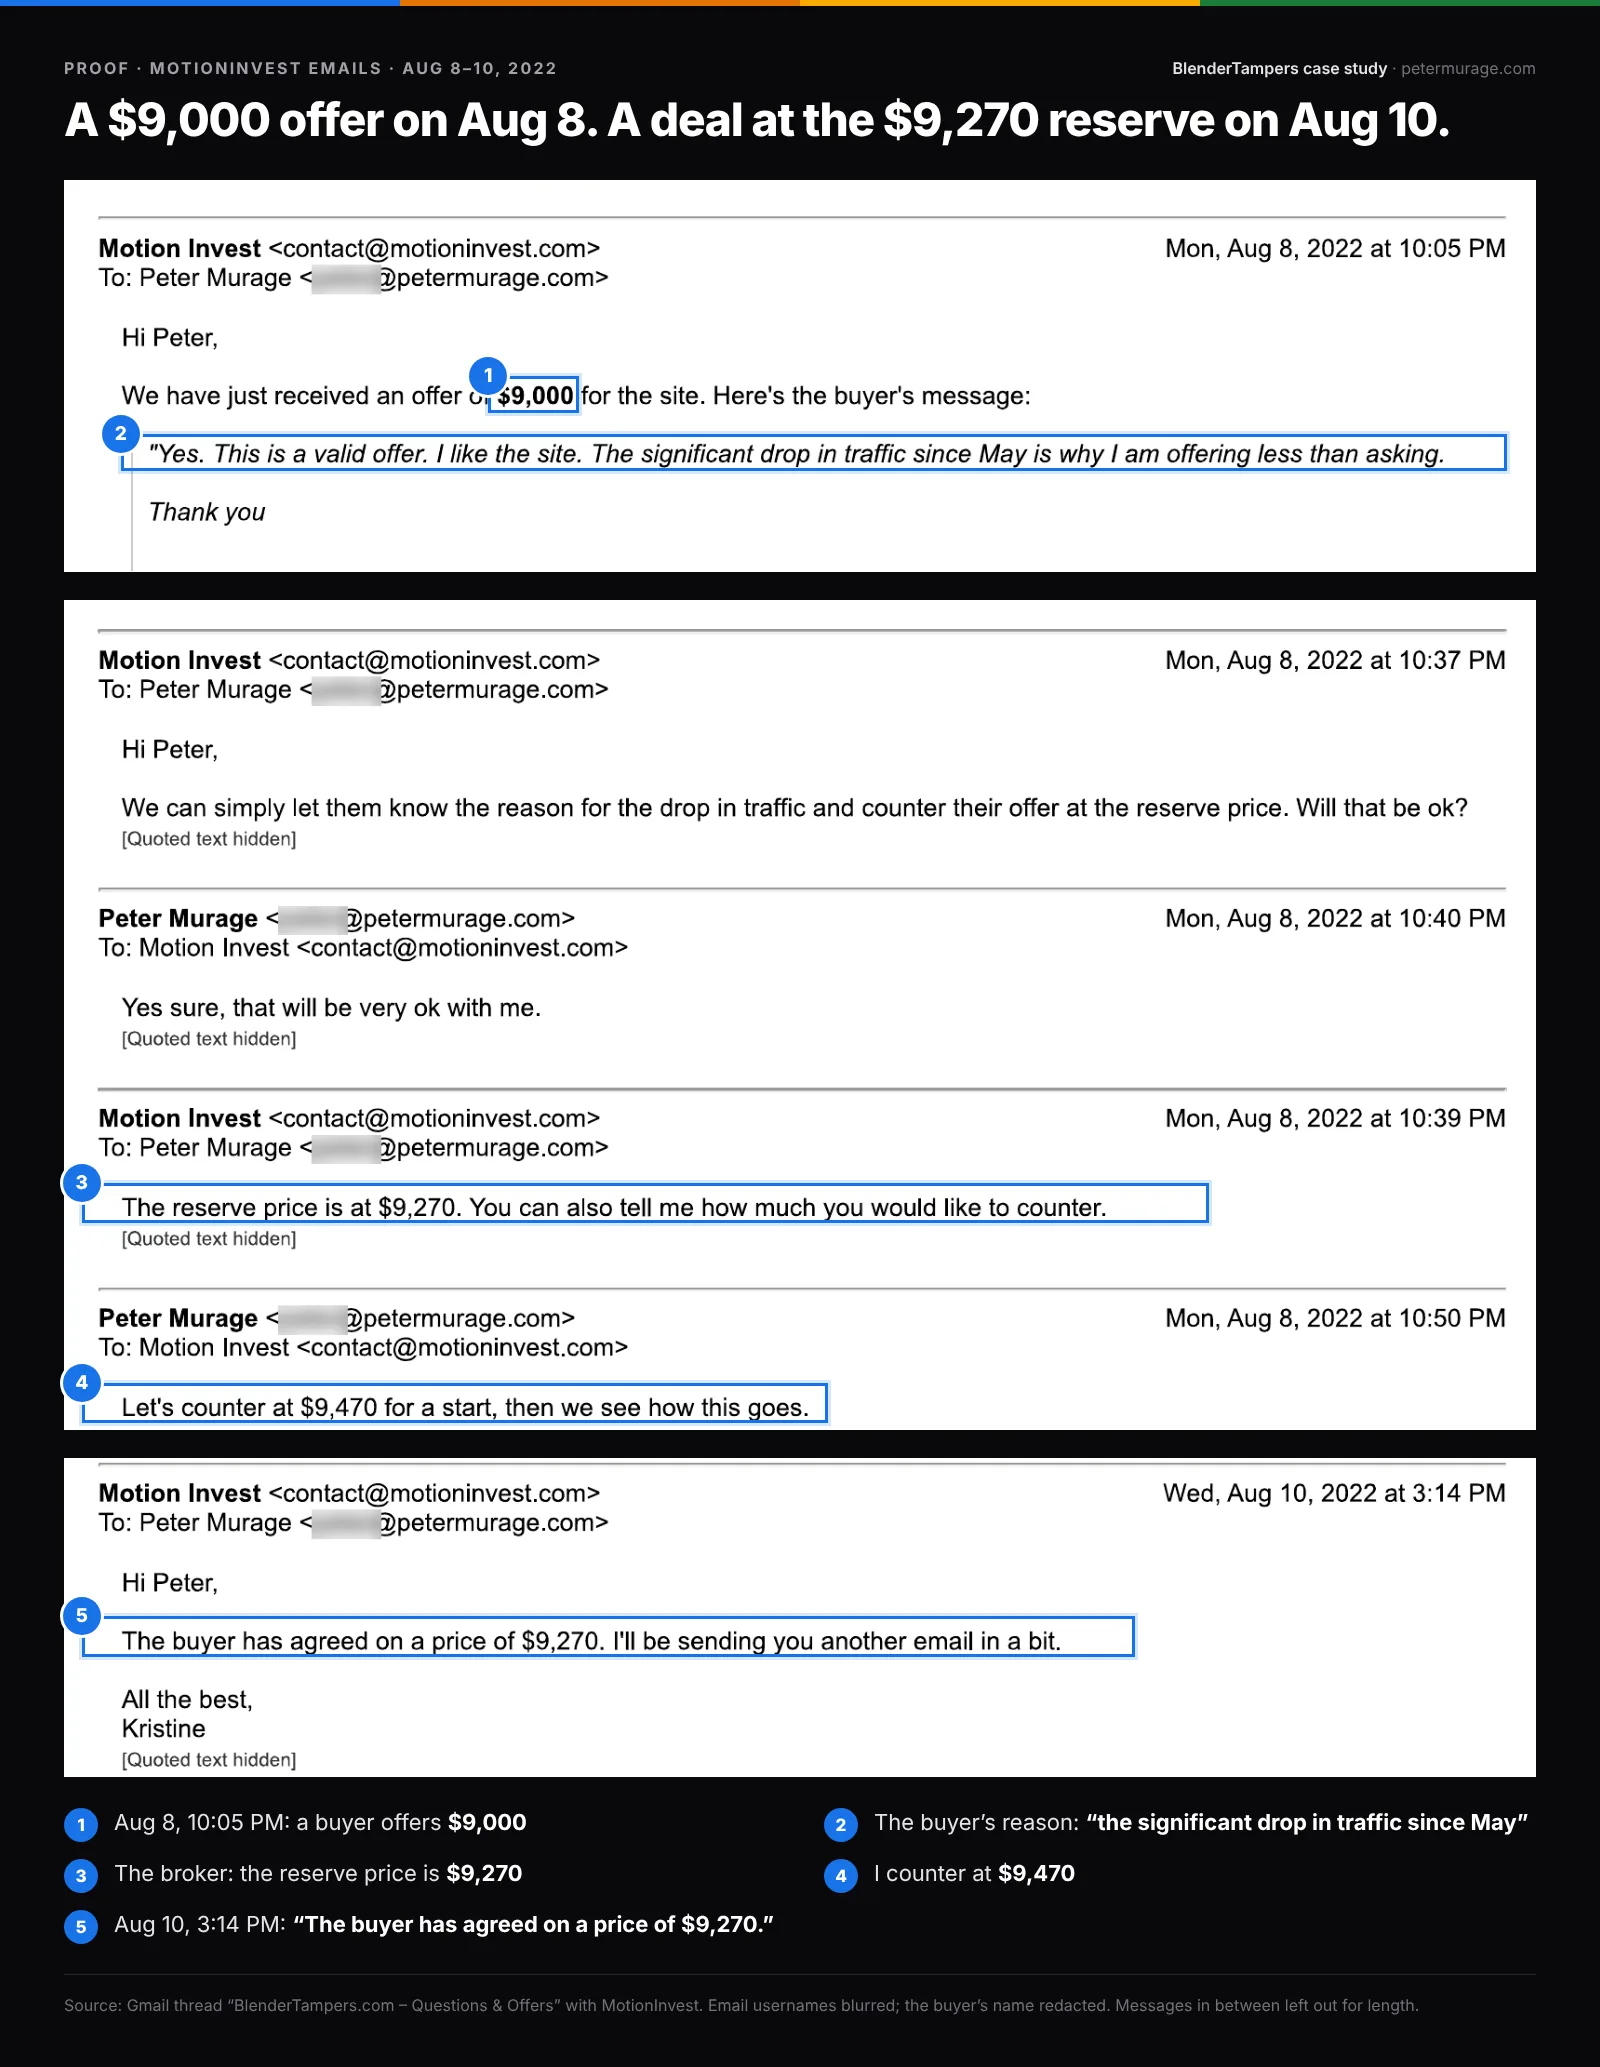
- Aug 8: a buyer offered $9,000, citing “the significant drop in traffic since May”. I countered at $9,470.
- Aug 10: we agreed at the $9,270 reserve. That’s 31x the $299 average monthly profit, for a site that took about 2 hours a month.
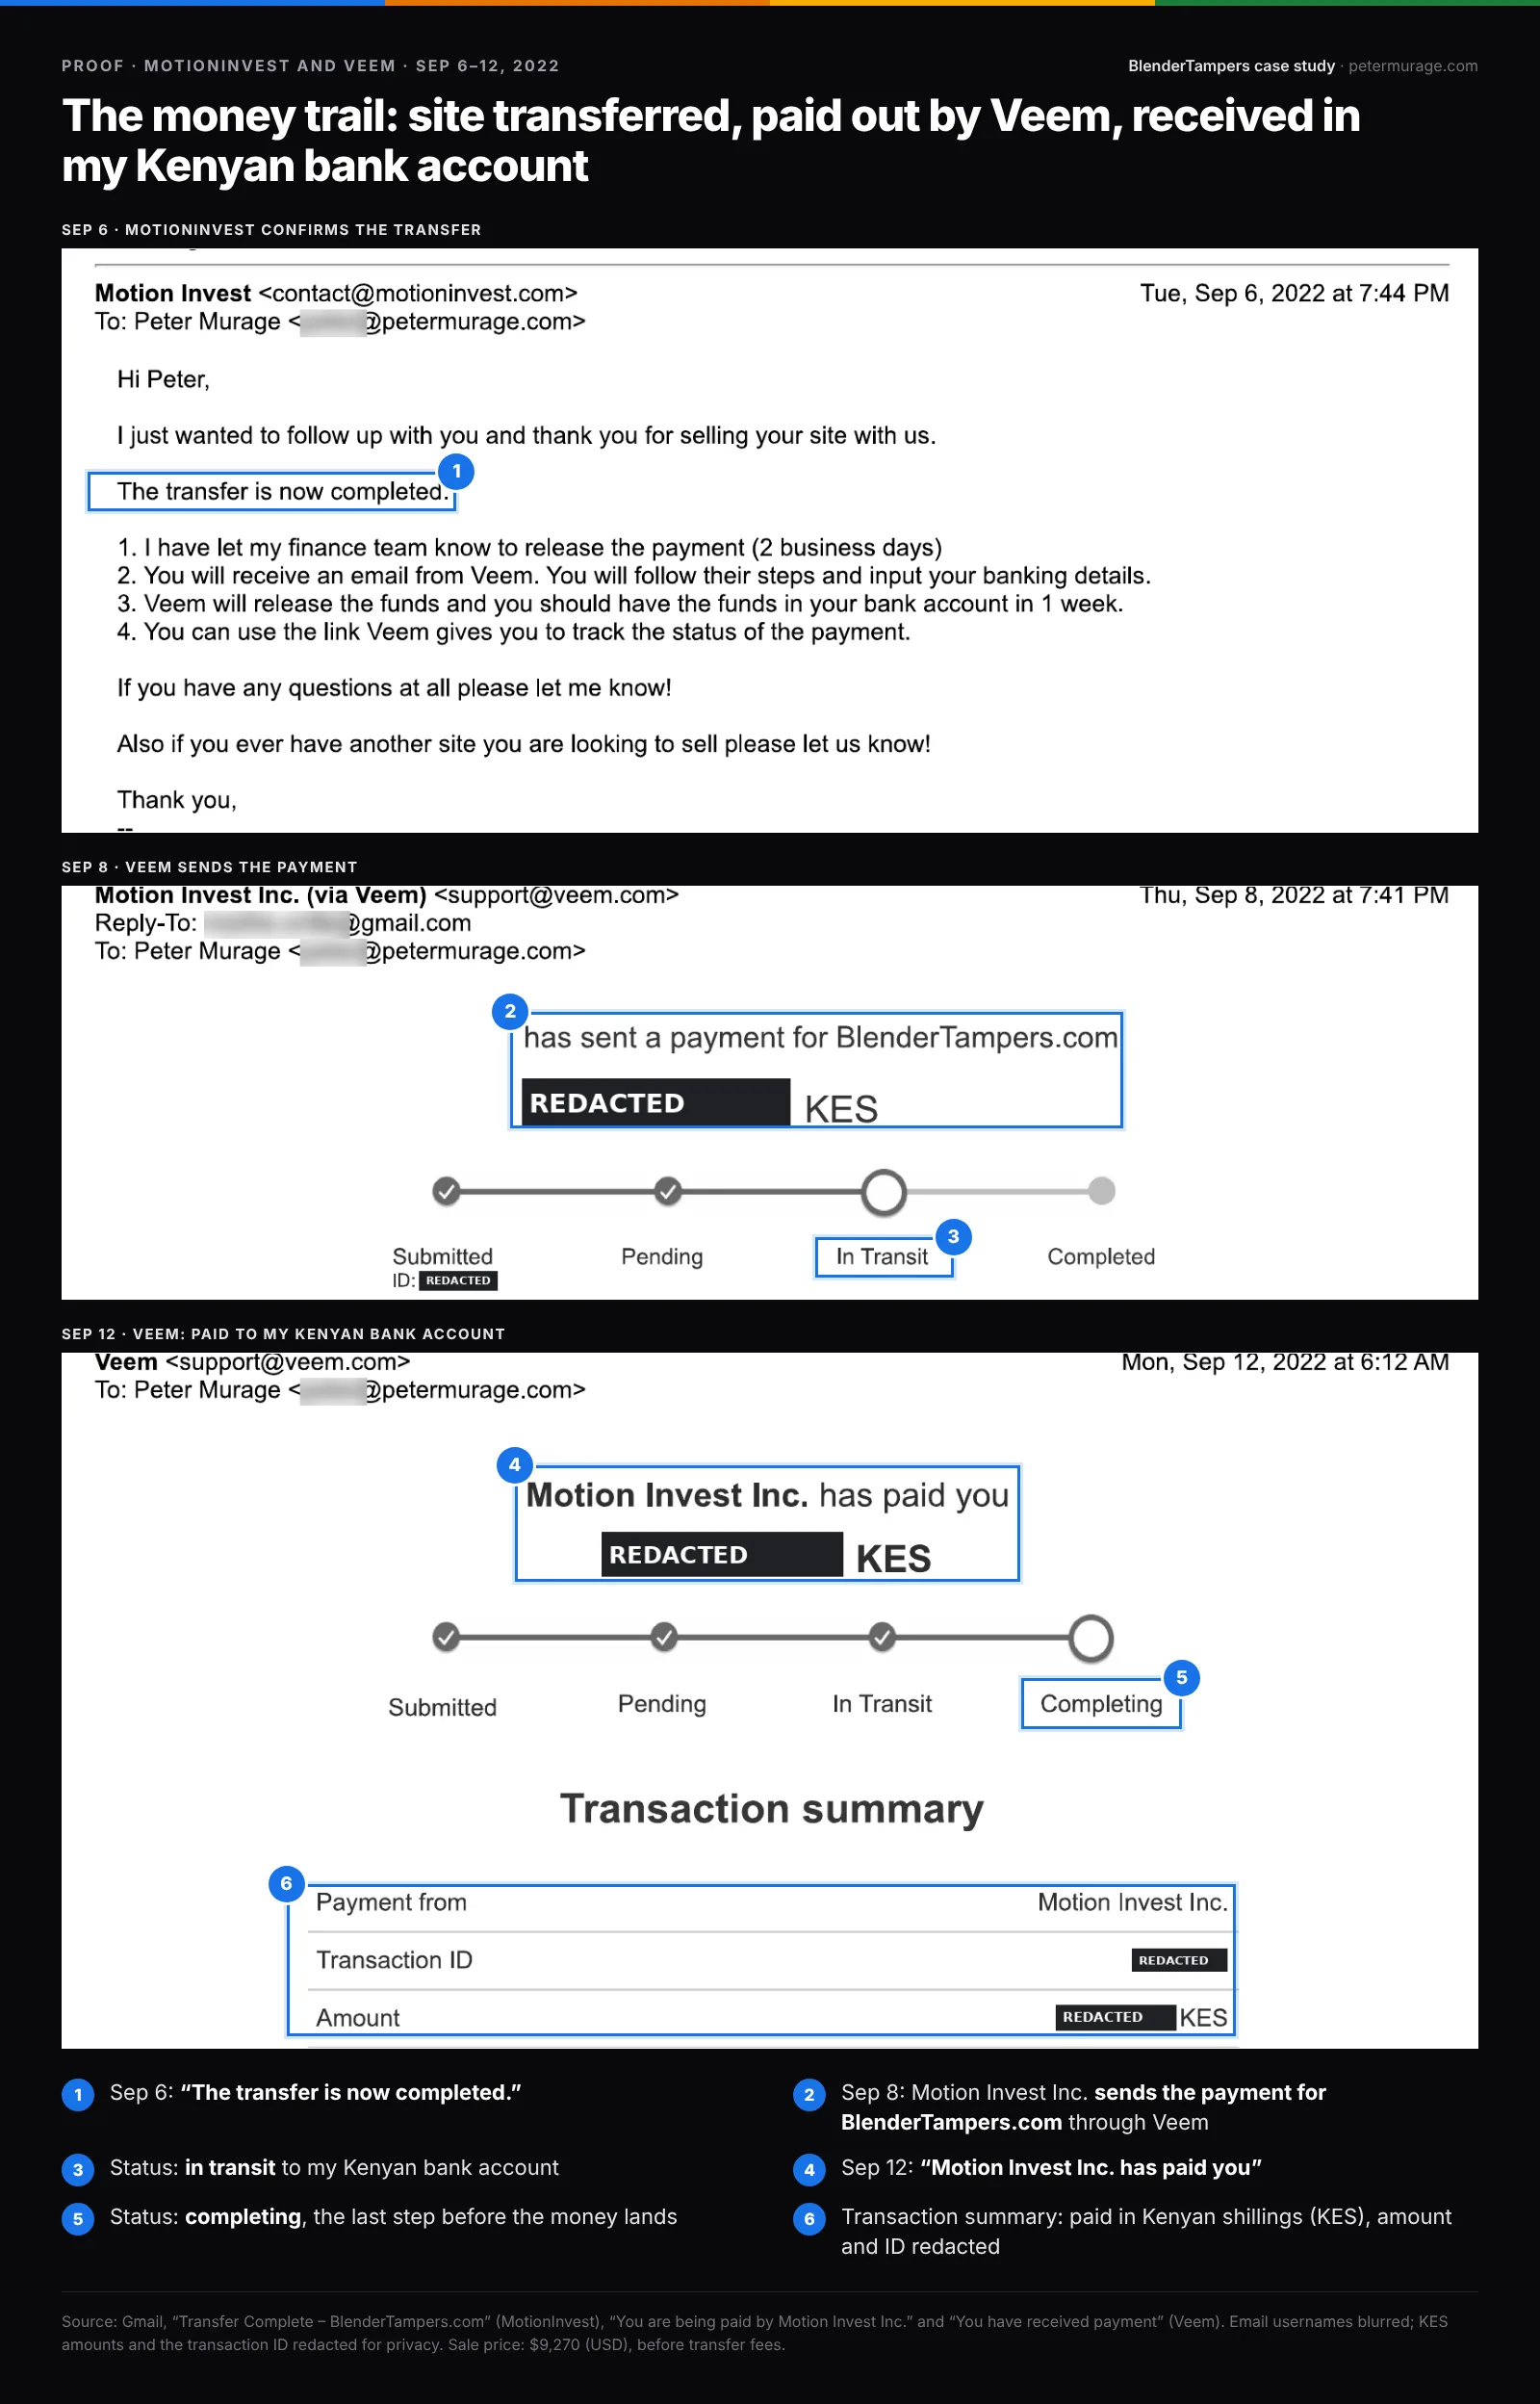
- Sep 6 to Sep 12: the transfer completed, and Veem paid the money into my Kenyan bank account.
07What went wrong
BOFU Pages Keep Selling After You Stop. Rankings Don’t.
- I stopped updating in mid-April 2022. Family matters took over. Pageviews fell from 3,173 in April to 1,677 in June.
- Search visitors fell 29.5% in the 28 days to August 16, 2022, compared with the 28 days before that.
- The drop cost me leverage. The buyer opened $870 under the asking price. We closed at the reserve, $600 under it.
- Small revenue leaks. 12 Amazon links were missing my affiliate tag, and 6 pointed to out-of-stock products. A monthly check would have caught both.
08The playbook for B2B SaaS
Six Lessons I Bring to Every Content Plan
LESSON 1
Start Where Buyers Argue
Mine Reddit, G2 reviews, sales calls, and community threads for their exact words, before you open a keyword tool.
LESSON 2
Ship Comparison Pages Before Blog Posts
“X vs Y” queries brought 35% of search clicks here. Your shortlist pages deserve the same priority.
LESSON 3
Treat Compatibility as Content
Integration and “works with” pages answer the last objection before a purchase.
LESSON 4
Run Your Best Page Like a Product
One guide drove 53% of traffic. Give your top BOFU page landing-page care: design, updates, and links.
LESSON 5
Measure Revenue per Visit, Not Traffic
$159 per 1,000 pageviews, from about 1,900 visitors a month. Intent beats volume.
LESSON 6
Refresh or Decay
Schedule quarterly updates for every money page. Stale pages still convert, but they slowly stop ranking.
The raw data
Every Screenshot, Unedited Apart From Markers and Redactions
Amazon Associates, Google Analytics, Search Console, Site Kit, Semrush, SiteBuddy, MotionInvest, and Veem. Email usernames are blurred for privacy. Amounts in Kenyan shillings, the buyer’s name, and the transaction ID are redacted. Click any image to see it full size.
Amazon, July 2022 record month
Amazon, 2021 vs 2022
Google Analytics, all pages
Search Console, top 24 queries
Site Kit, Jul 20 – Aug 16, 2022
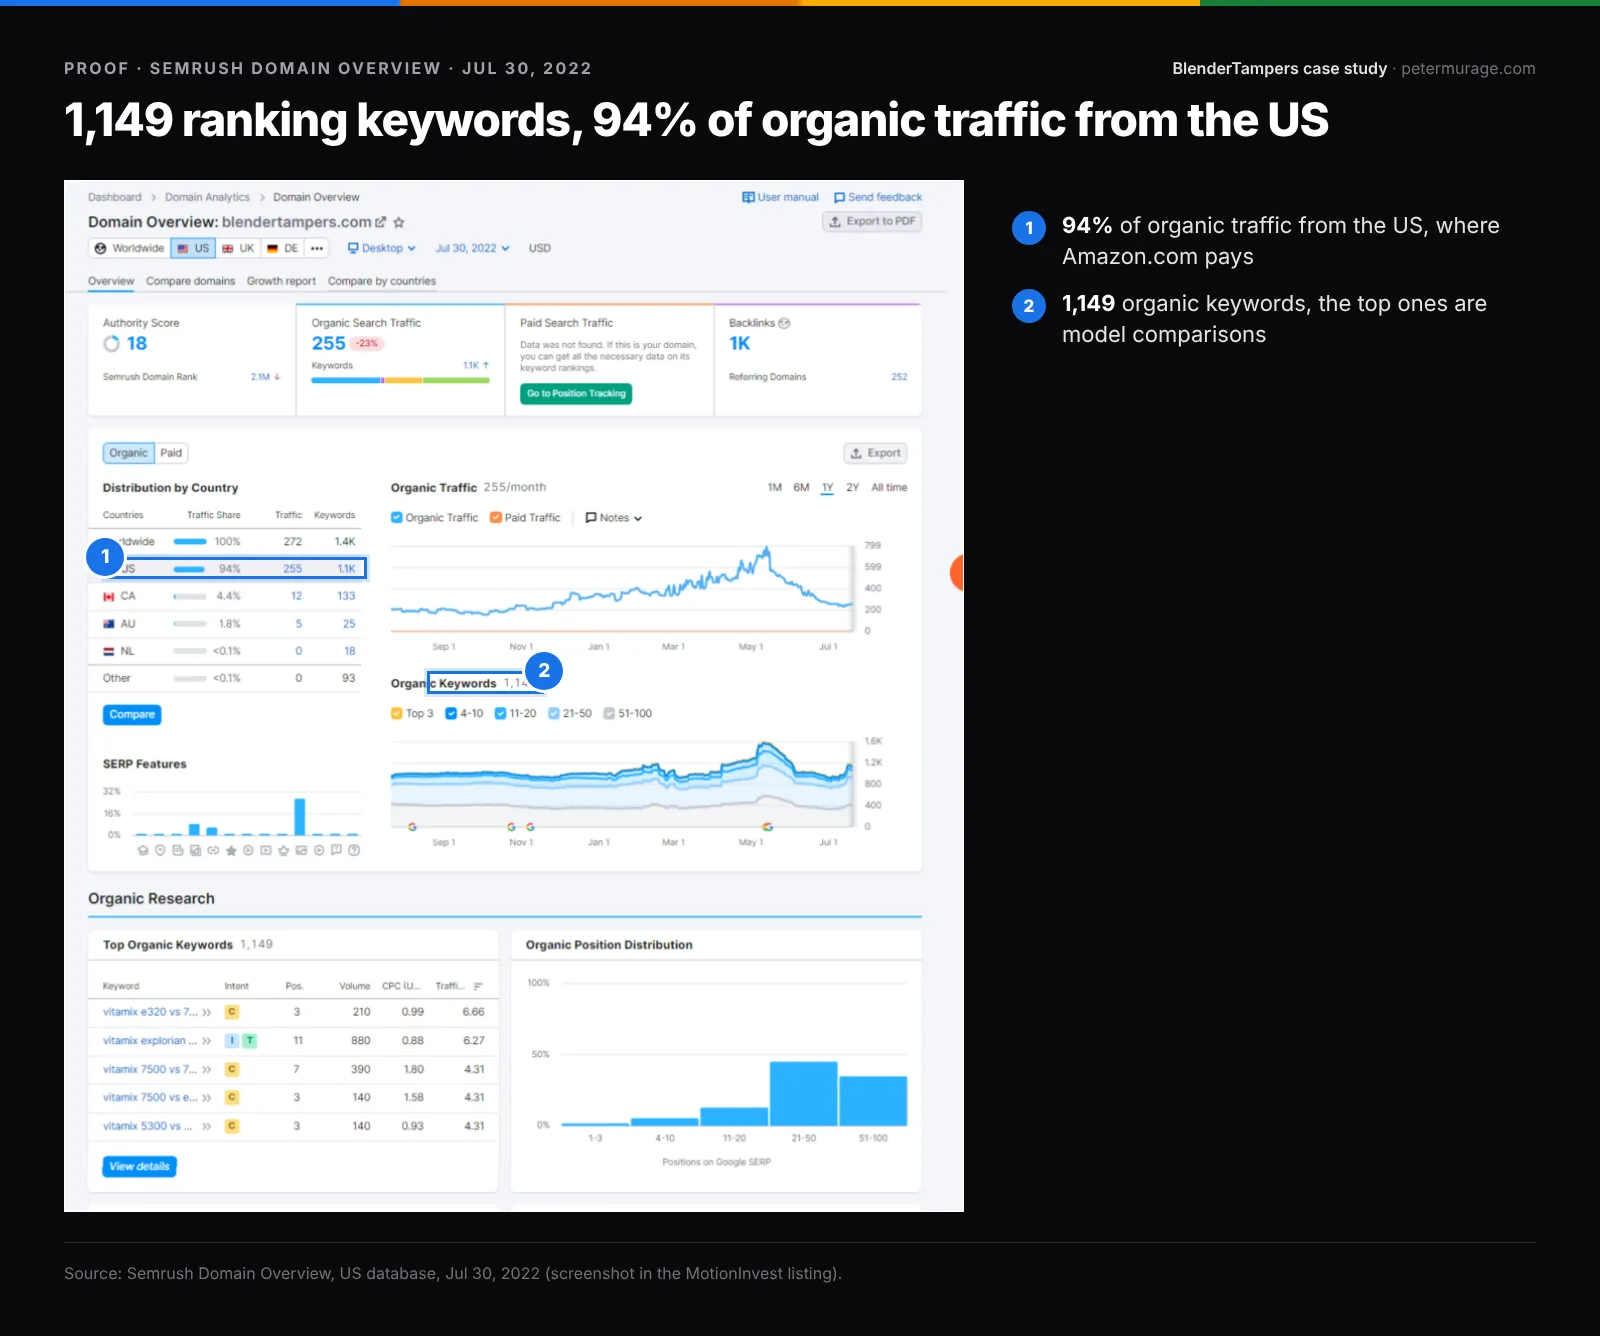 Semrush, domain overview
 SiteBuddy, Amazon link audit
The homepage, 2022
 MotionInvest, submitted Jul 28
 MotionInvest, the listing
MotionInvest, offer and deal
Veem, paid to my Kenyan bank

Work with me
Want Pages That Bring in Buyers, Not Browsers?
I write comparison, alternatives, integration, and use-case pages for B2B SaaS teams. On a free 20-minute call, I’ll review 2–3 of yours and send a written summary within 24 hours.
Free · 20 minutes · 3 founding client spots for Q1 2027